Tracing libjxl decoding patterns, with JPEG XL as the trace data container
I wanted to understand the order in which libjxl decodes an image. Which strips come first, which threads grab them, and how all of that shifts as you add cores. So I instrumented the decoder, recorded a timestamp for every region as it landed, and rendered the result as a video.
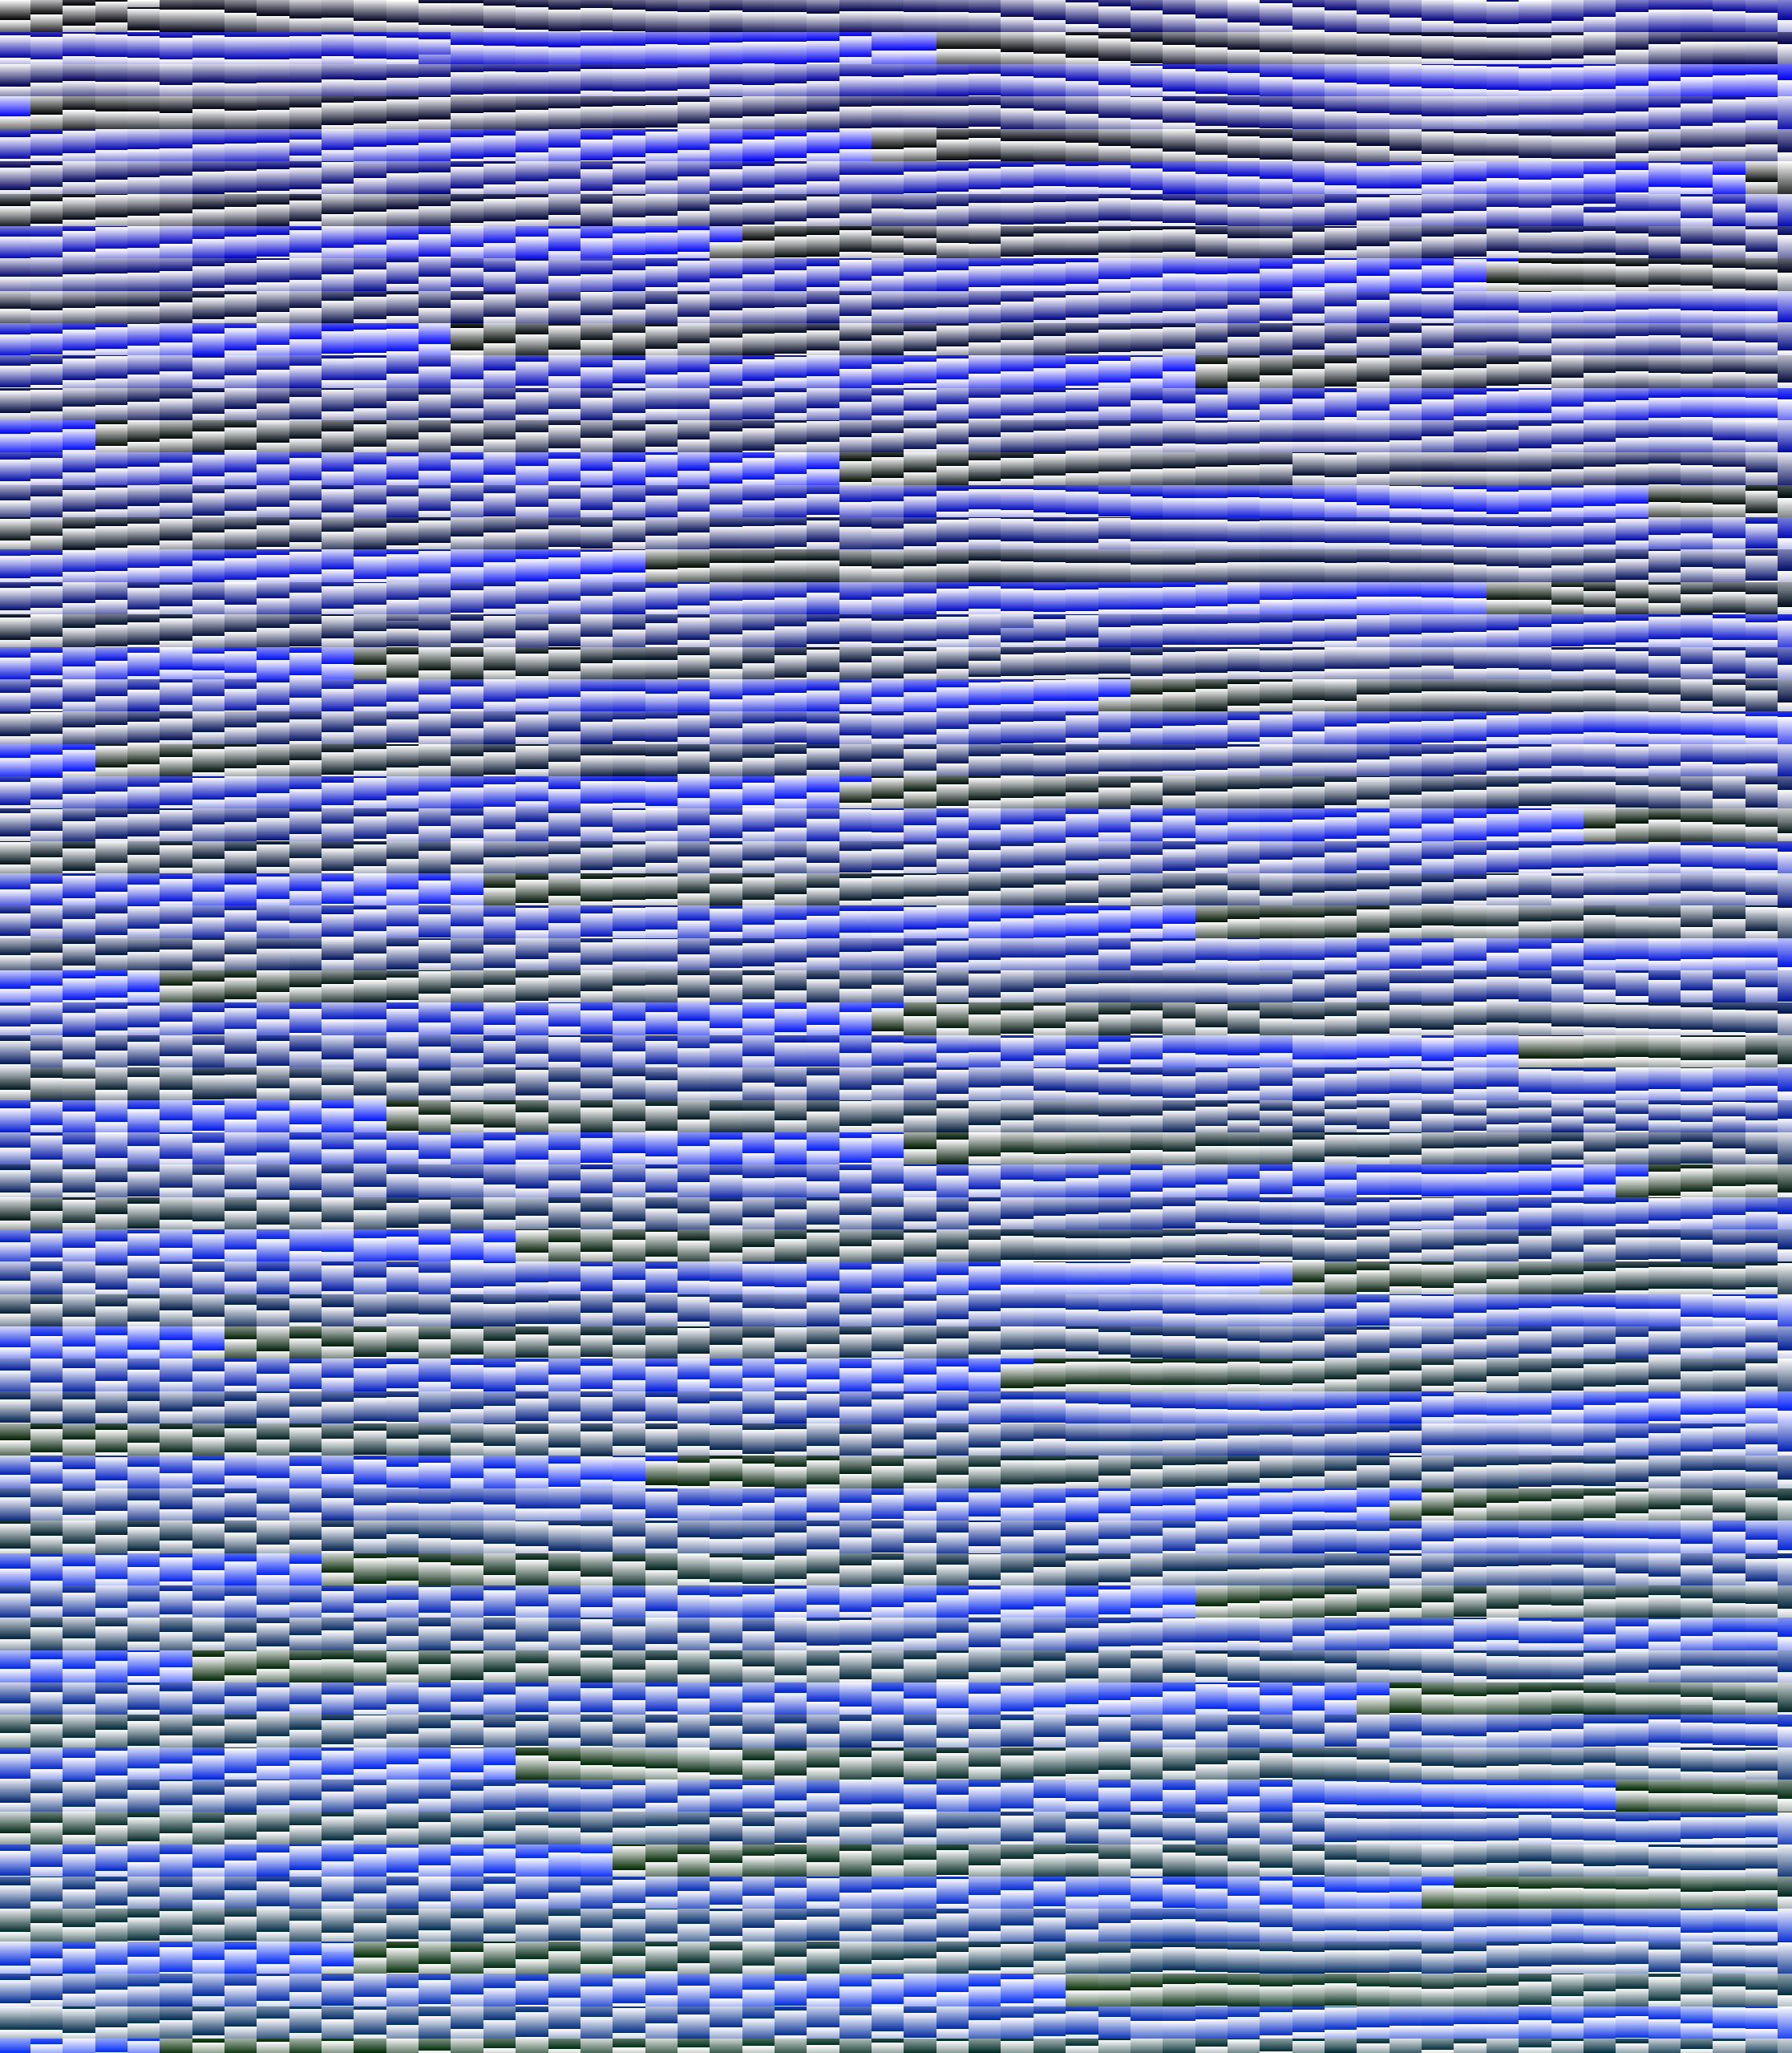
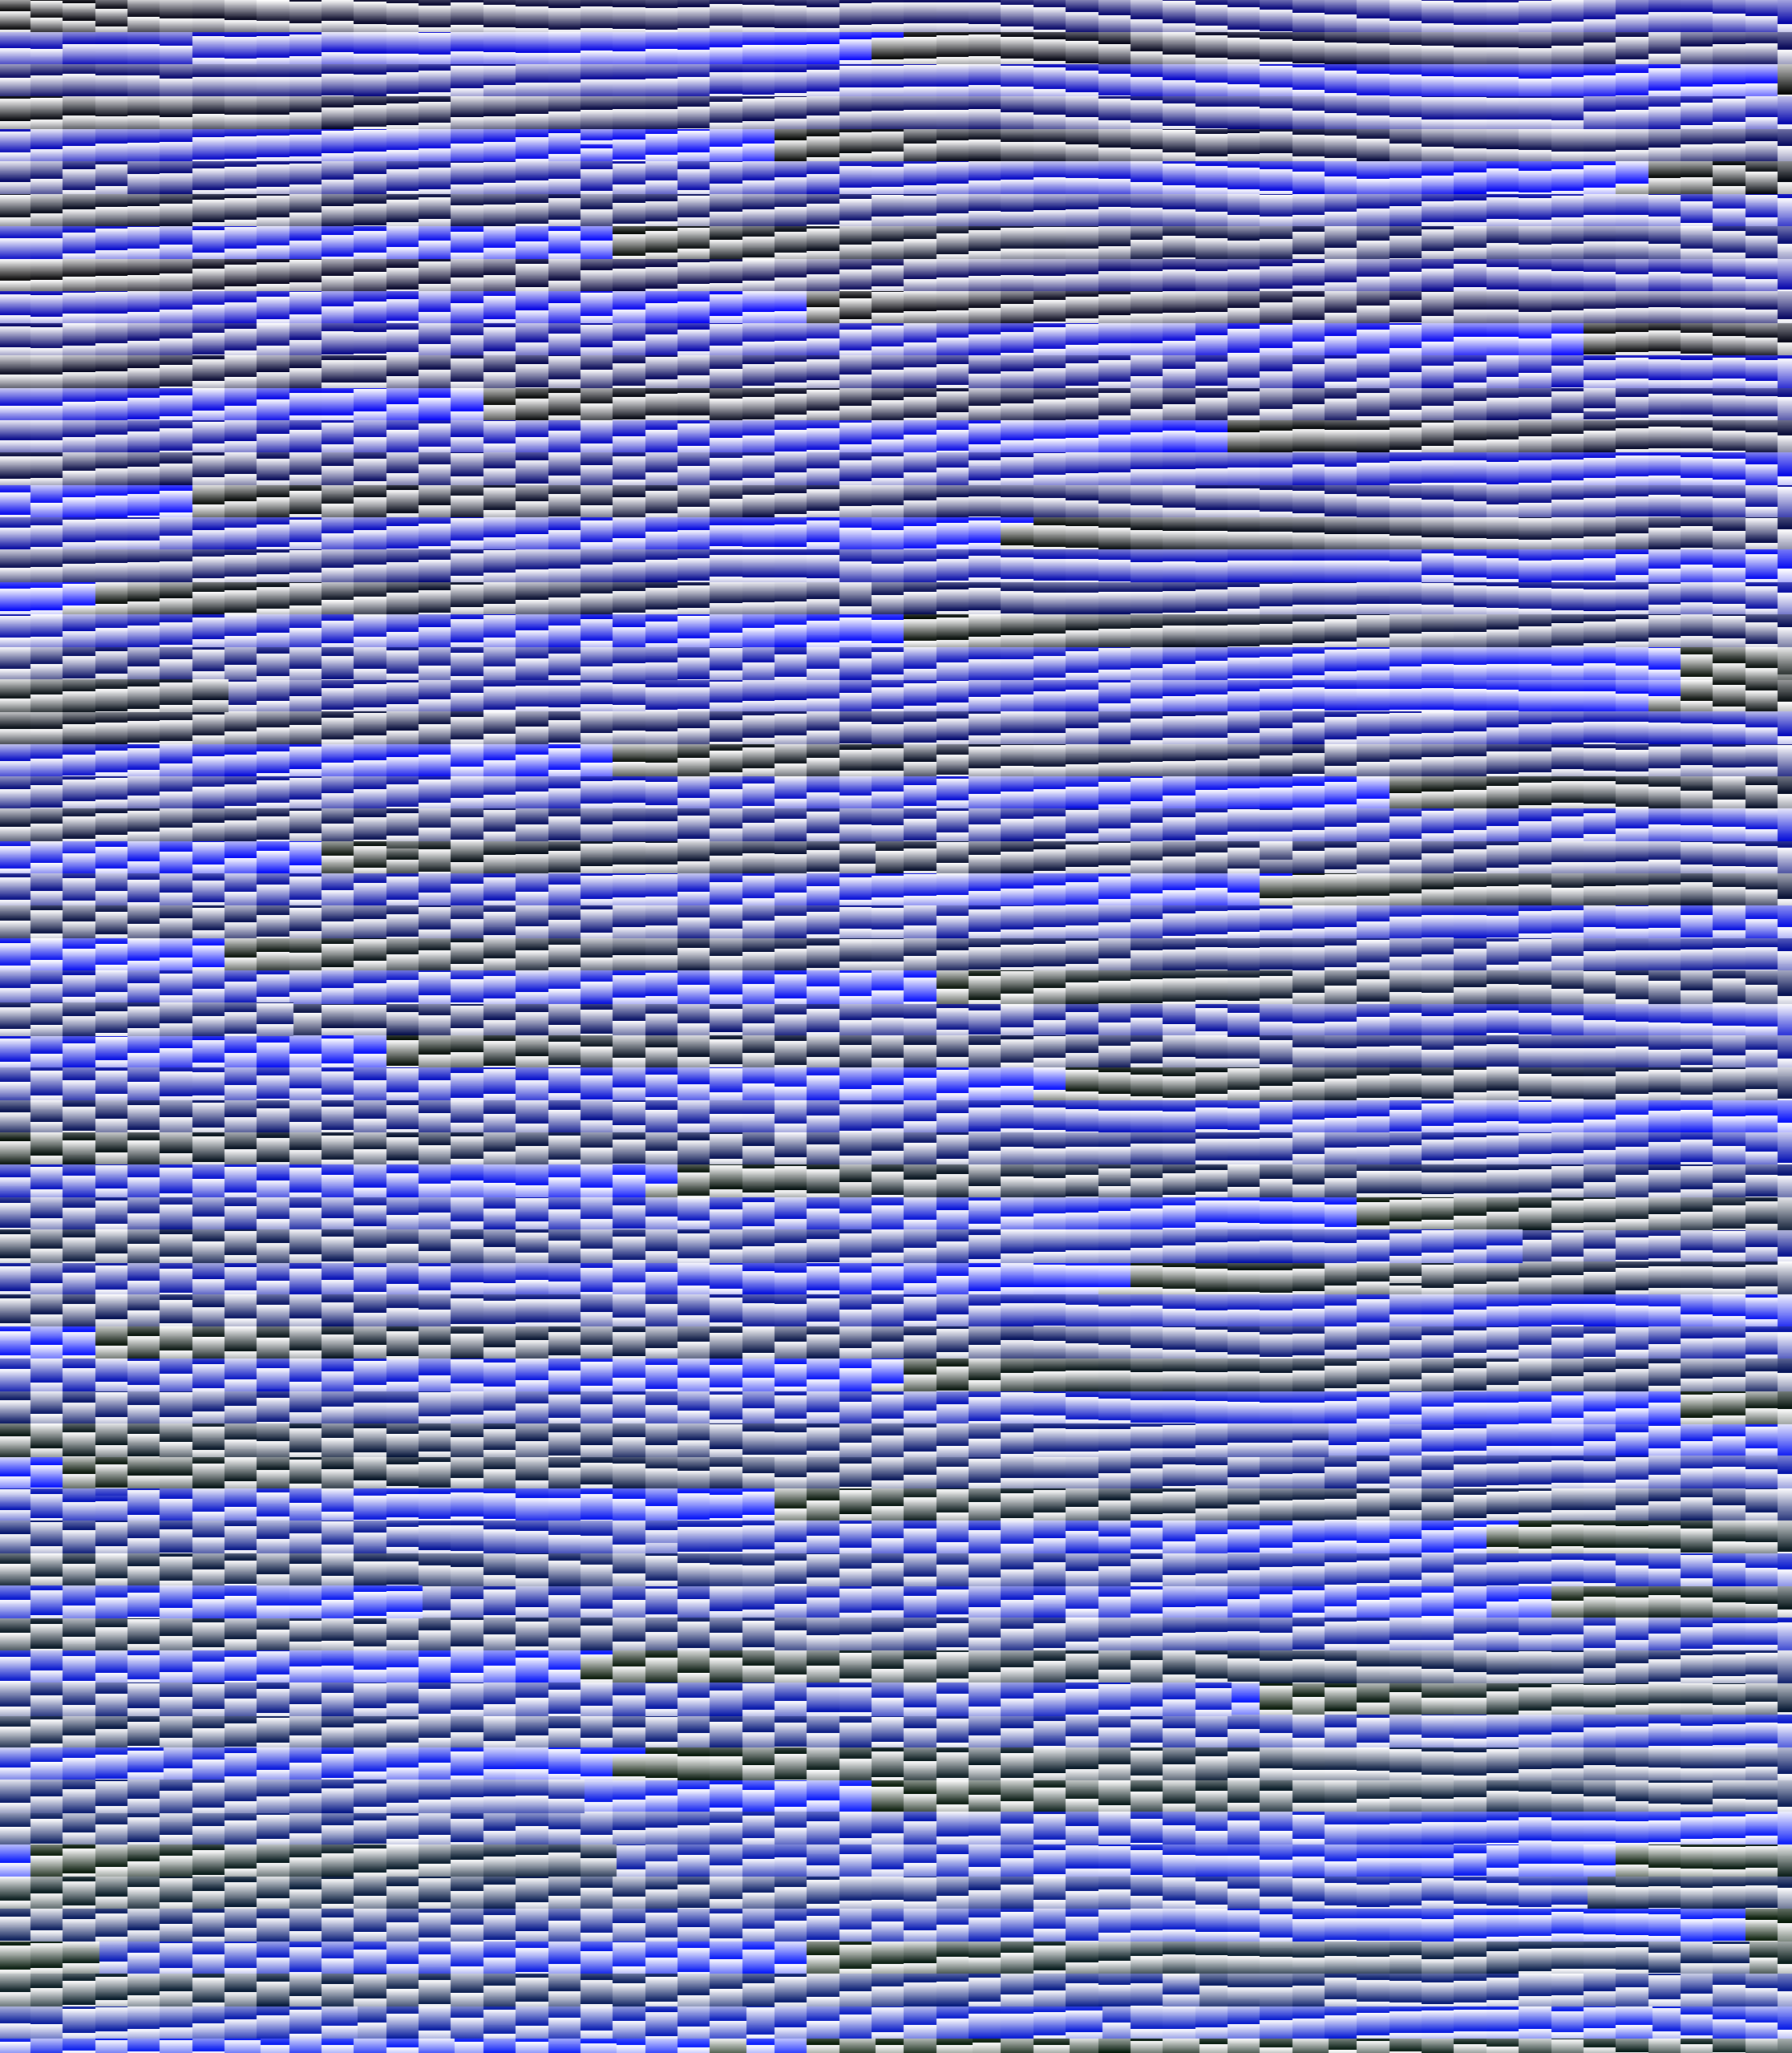
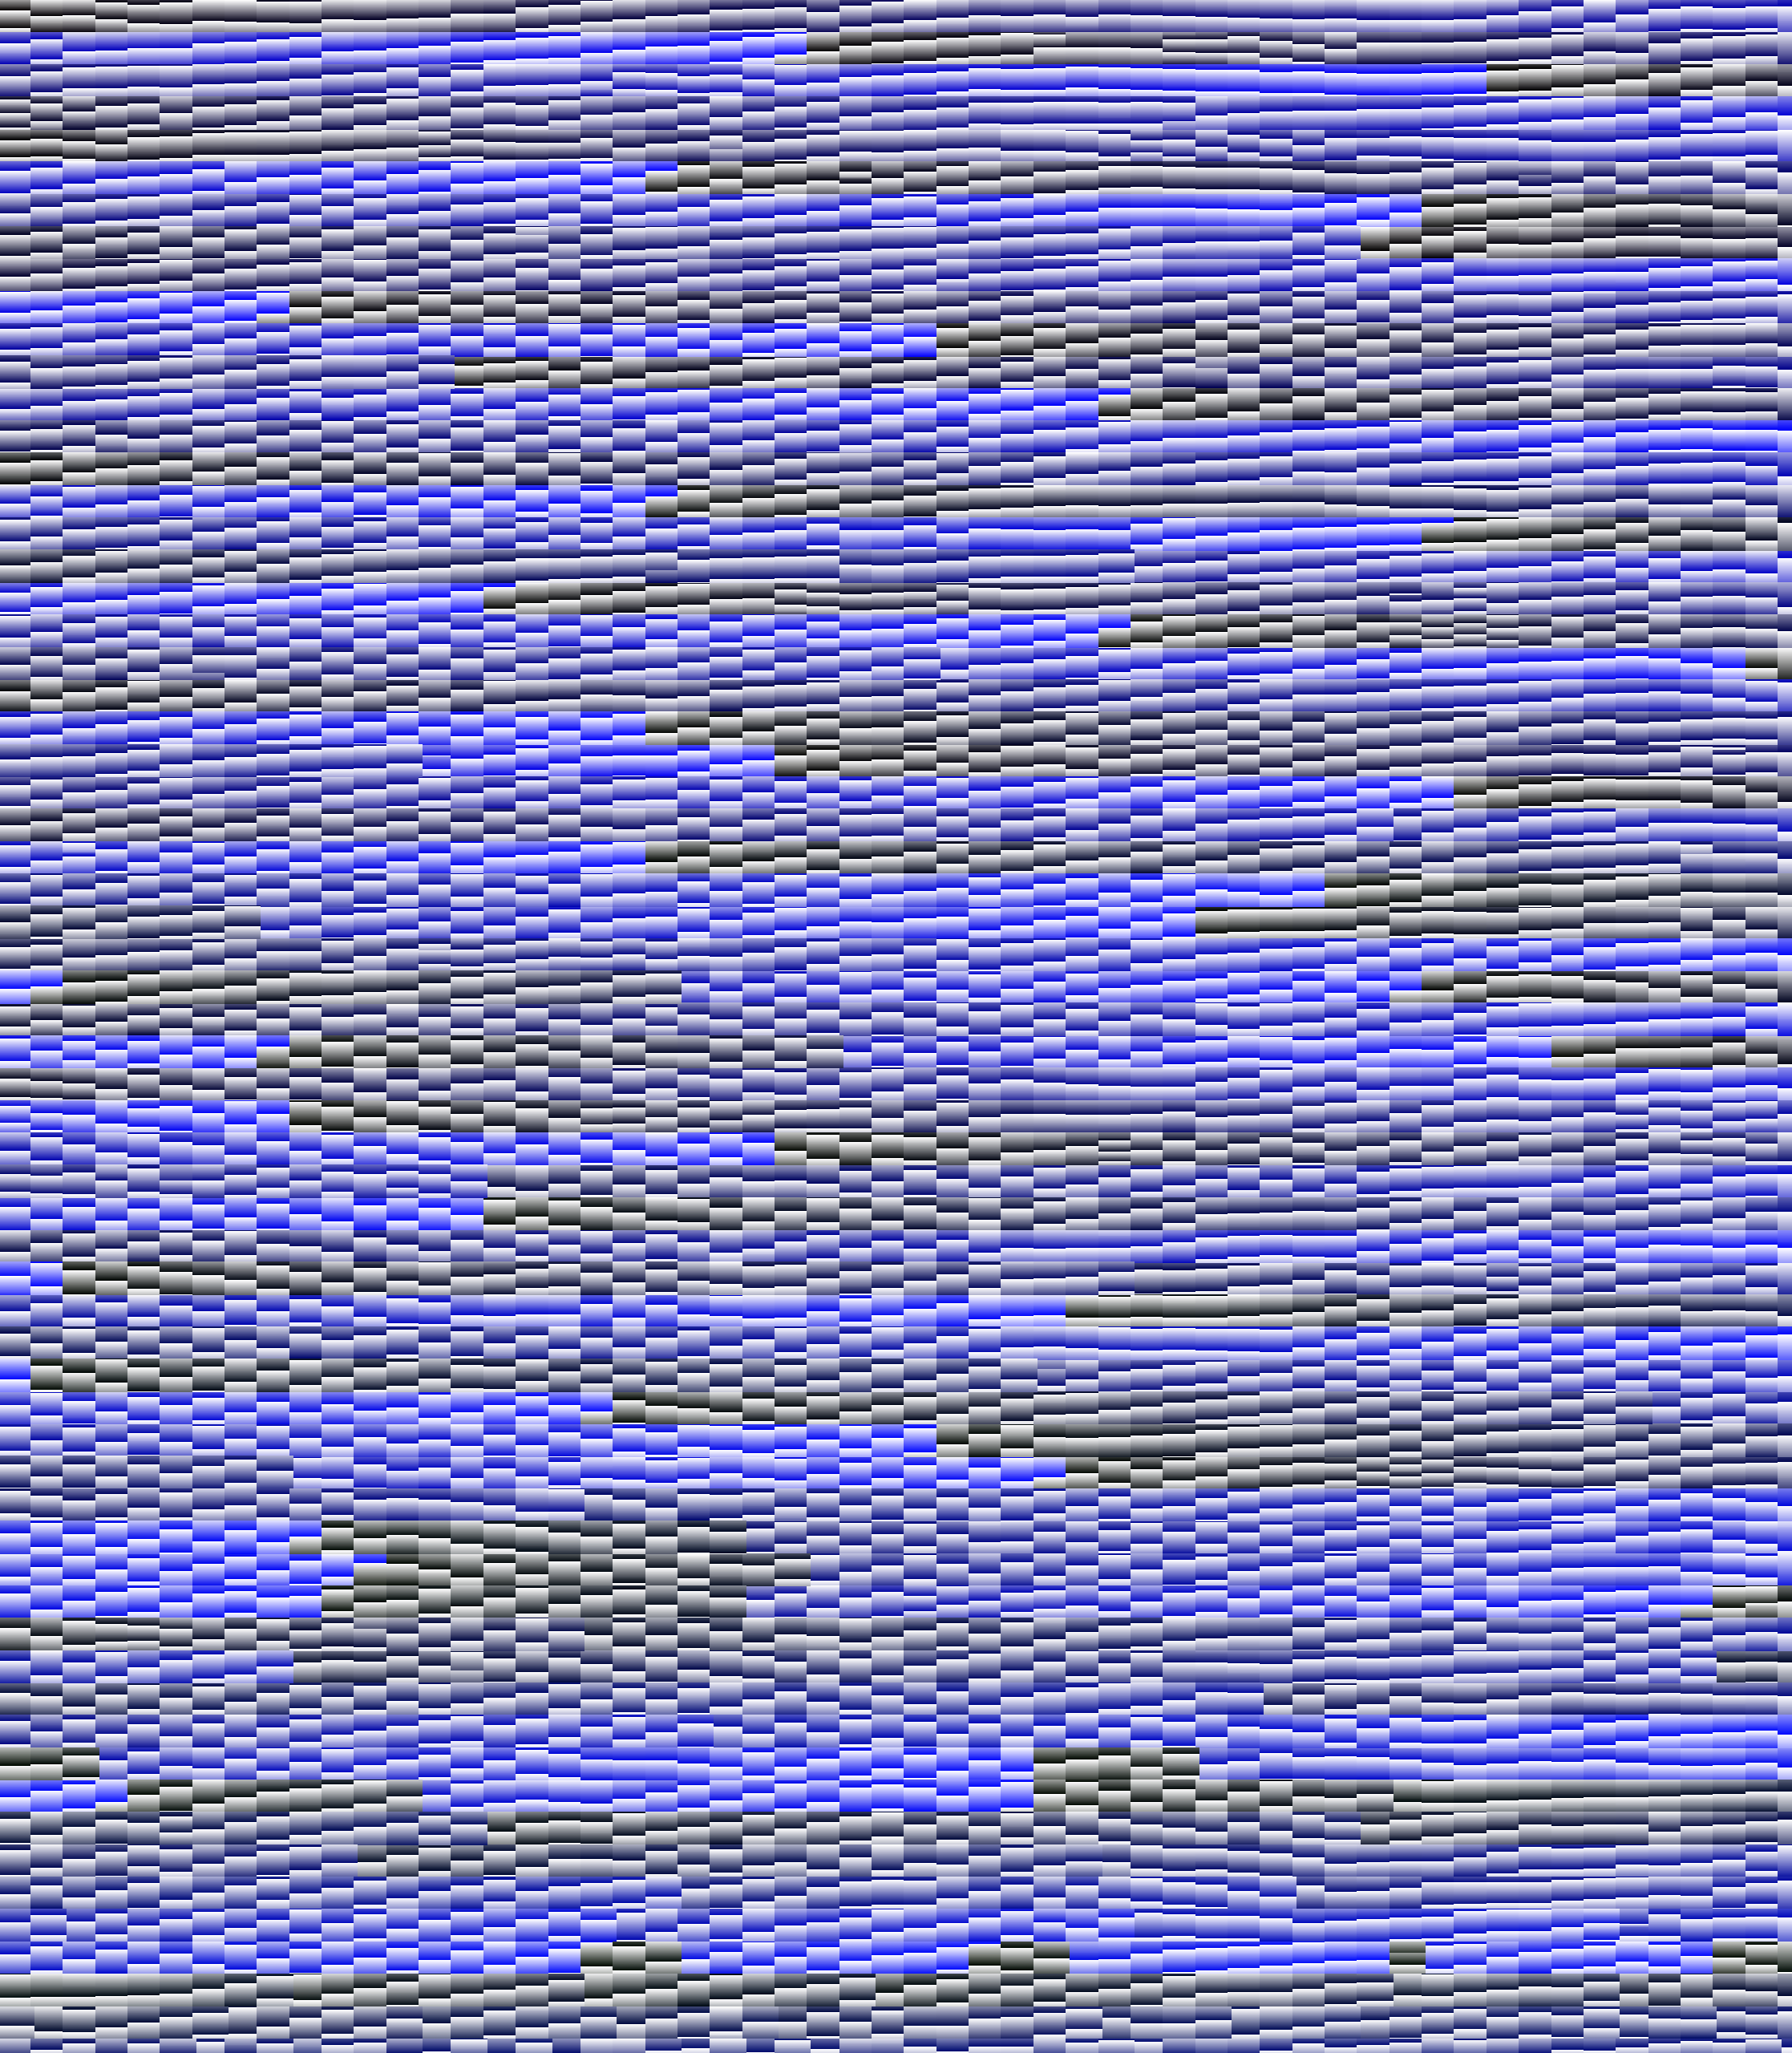
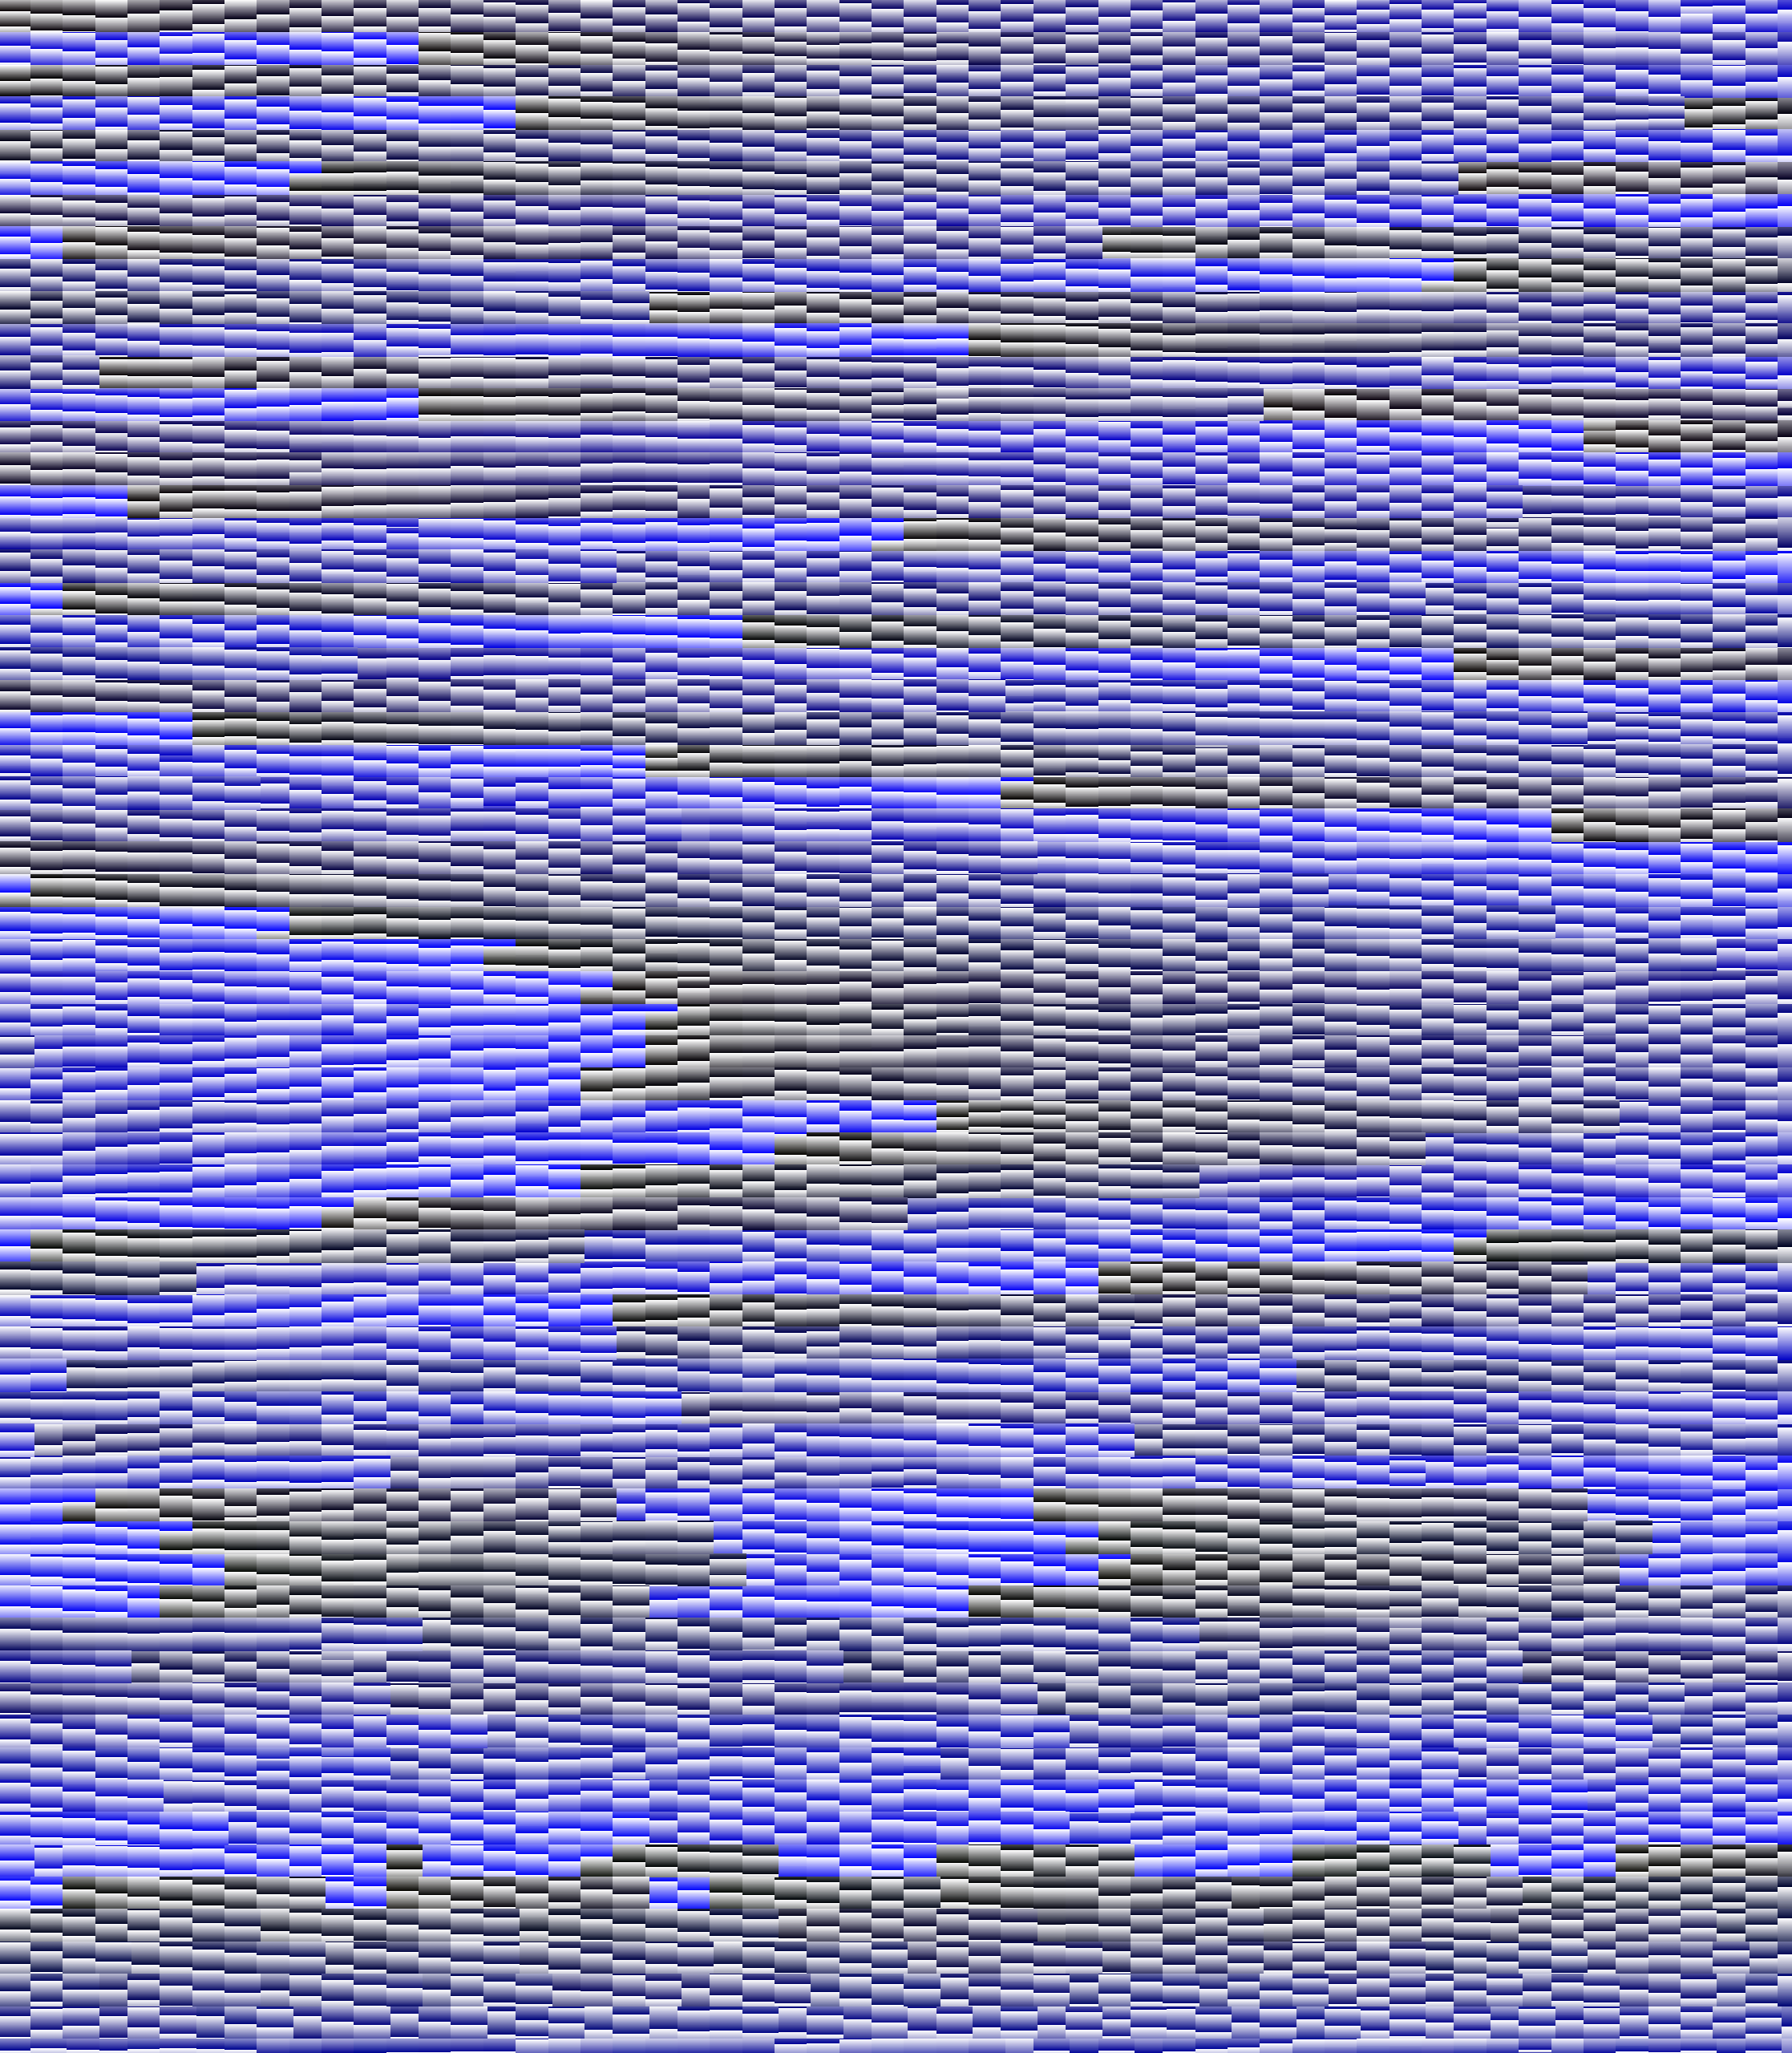
The twist: the intermediate container that stores the trace data is itself a JPEG XL image with the same dimensions as the input, encoded losslessly as 8-bit RGBA. The red channel holds the thread ID, green, blue, and alpha together form a 24-bit microsecond timestamp.
In the clips below, each pixel lights up in its thread's color the moment that region was delivered by the library via callback. Each clip is slowed down by the factor shown next to it (≈222× means one second of video is roughly 4.5 ms of actual decoding).
cargo.jxl: 14,178 × 16,239, 230.24 Mpx, RGB, 14.16 MB · ≈16.7× slowdown
pineapple-alpha.jxl: 2,560 × 1,600, 4.1 Mpx, RGBA, 1.56 MB · ≈222× slowdown
A caveat on the timing: the wall-clock microseconds in each trace are measured from the first worker callback that delivered pixels. 0 ms is when the first strip lands. libjxl's pre-callback setup and disk I/O are excluded.
The setup
The project is two small C programs:
jxl_tile_capturedecodes a.jxlwith libjxl's parallel runner and hooks the per-strip output callback. For every region the library hands back, it records the worker thread ID and a microsecond timestamp, then writes the result as a lossless 8-bit RGBA.jxlwith the same dimensions as the input.jxl_tile_videoreads that trace.jxland renders an mp4, lighting up each region in its thread's color at the moment the callback fired.
The traces were captured on an AMD Ryzen 7 5700X (8 physical cores / 16 SMT threads, 4.67 GHz max, with AVX2, F16C, and SHA-NI) backed by 62 GiB of RAM, running Fedora (Linux 7.0.9-205.fc44 x86_64). The toolchain was gcc 16.1.1 against libjxl 0.11.1.
The intermediate data
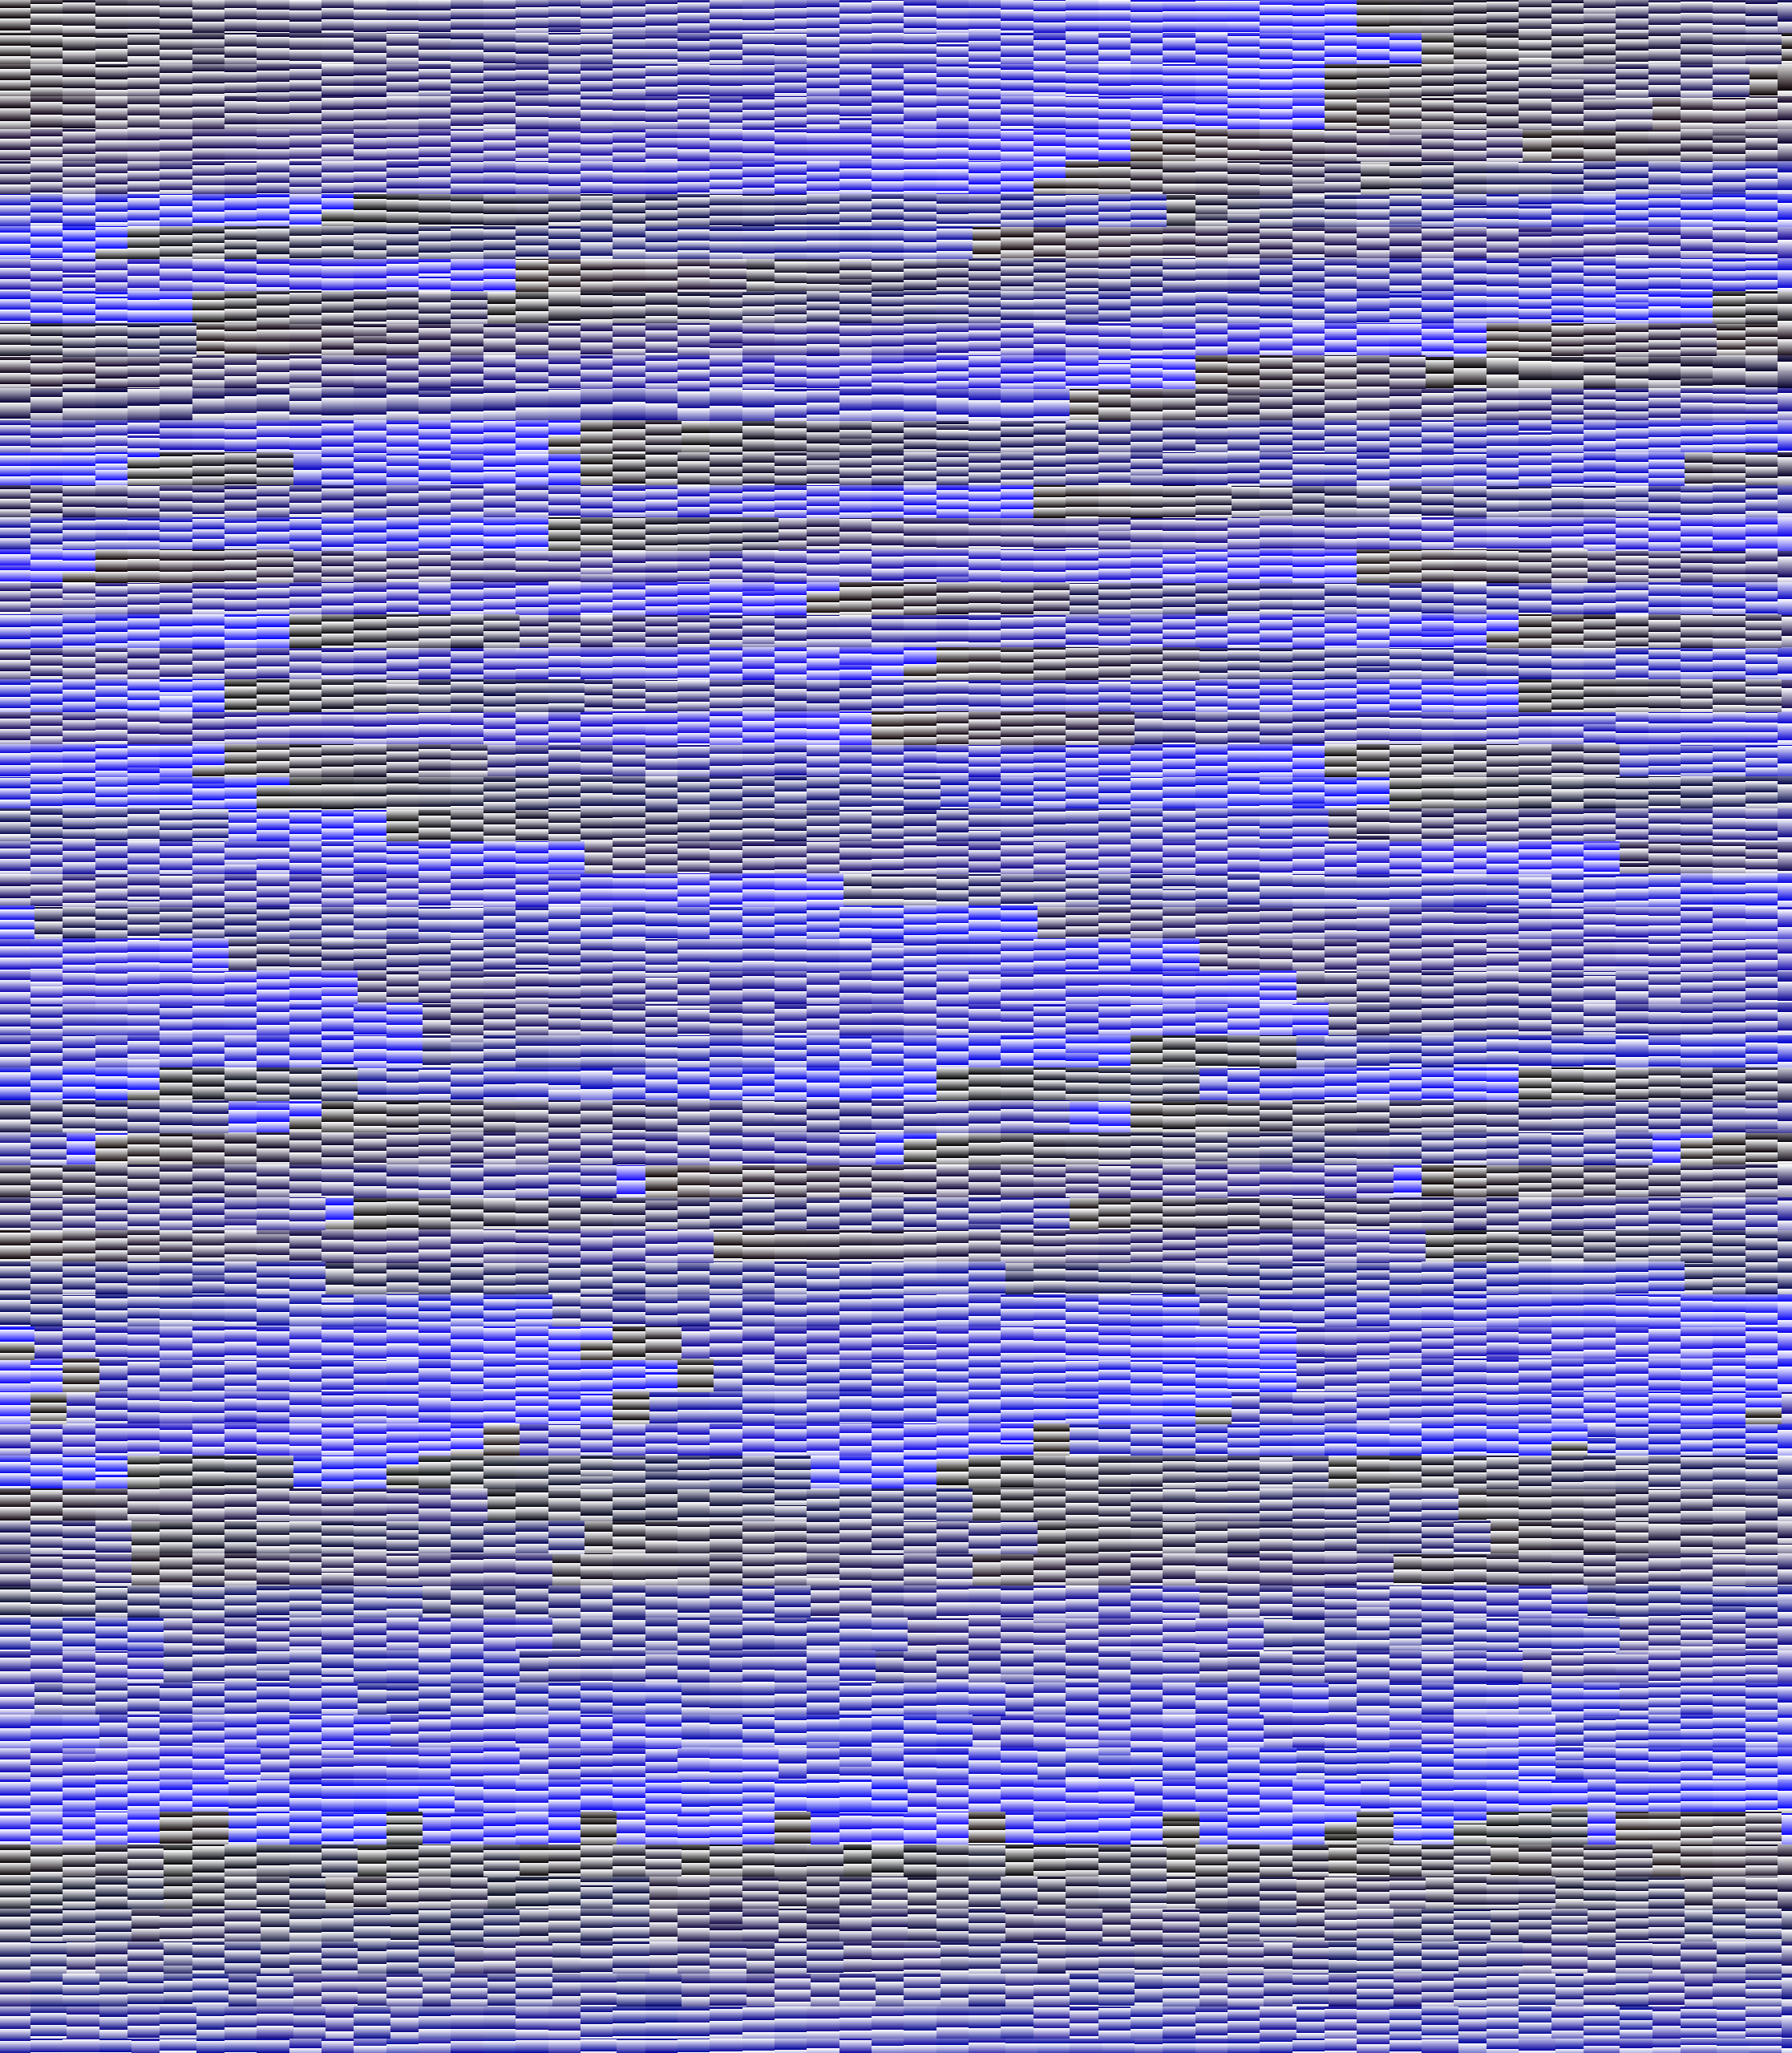
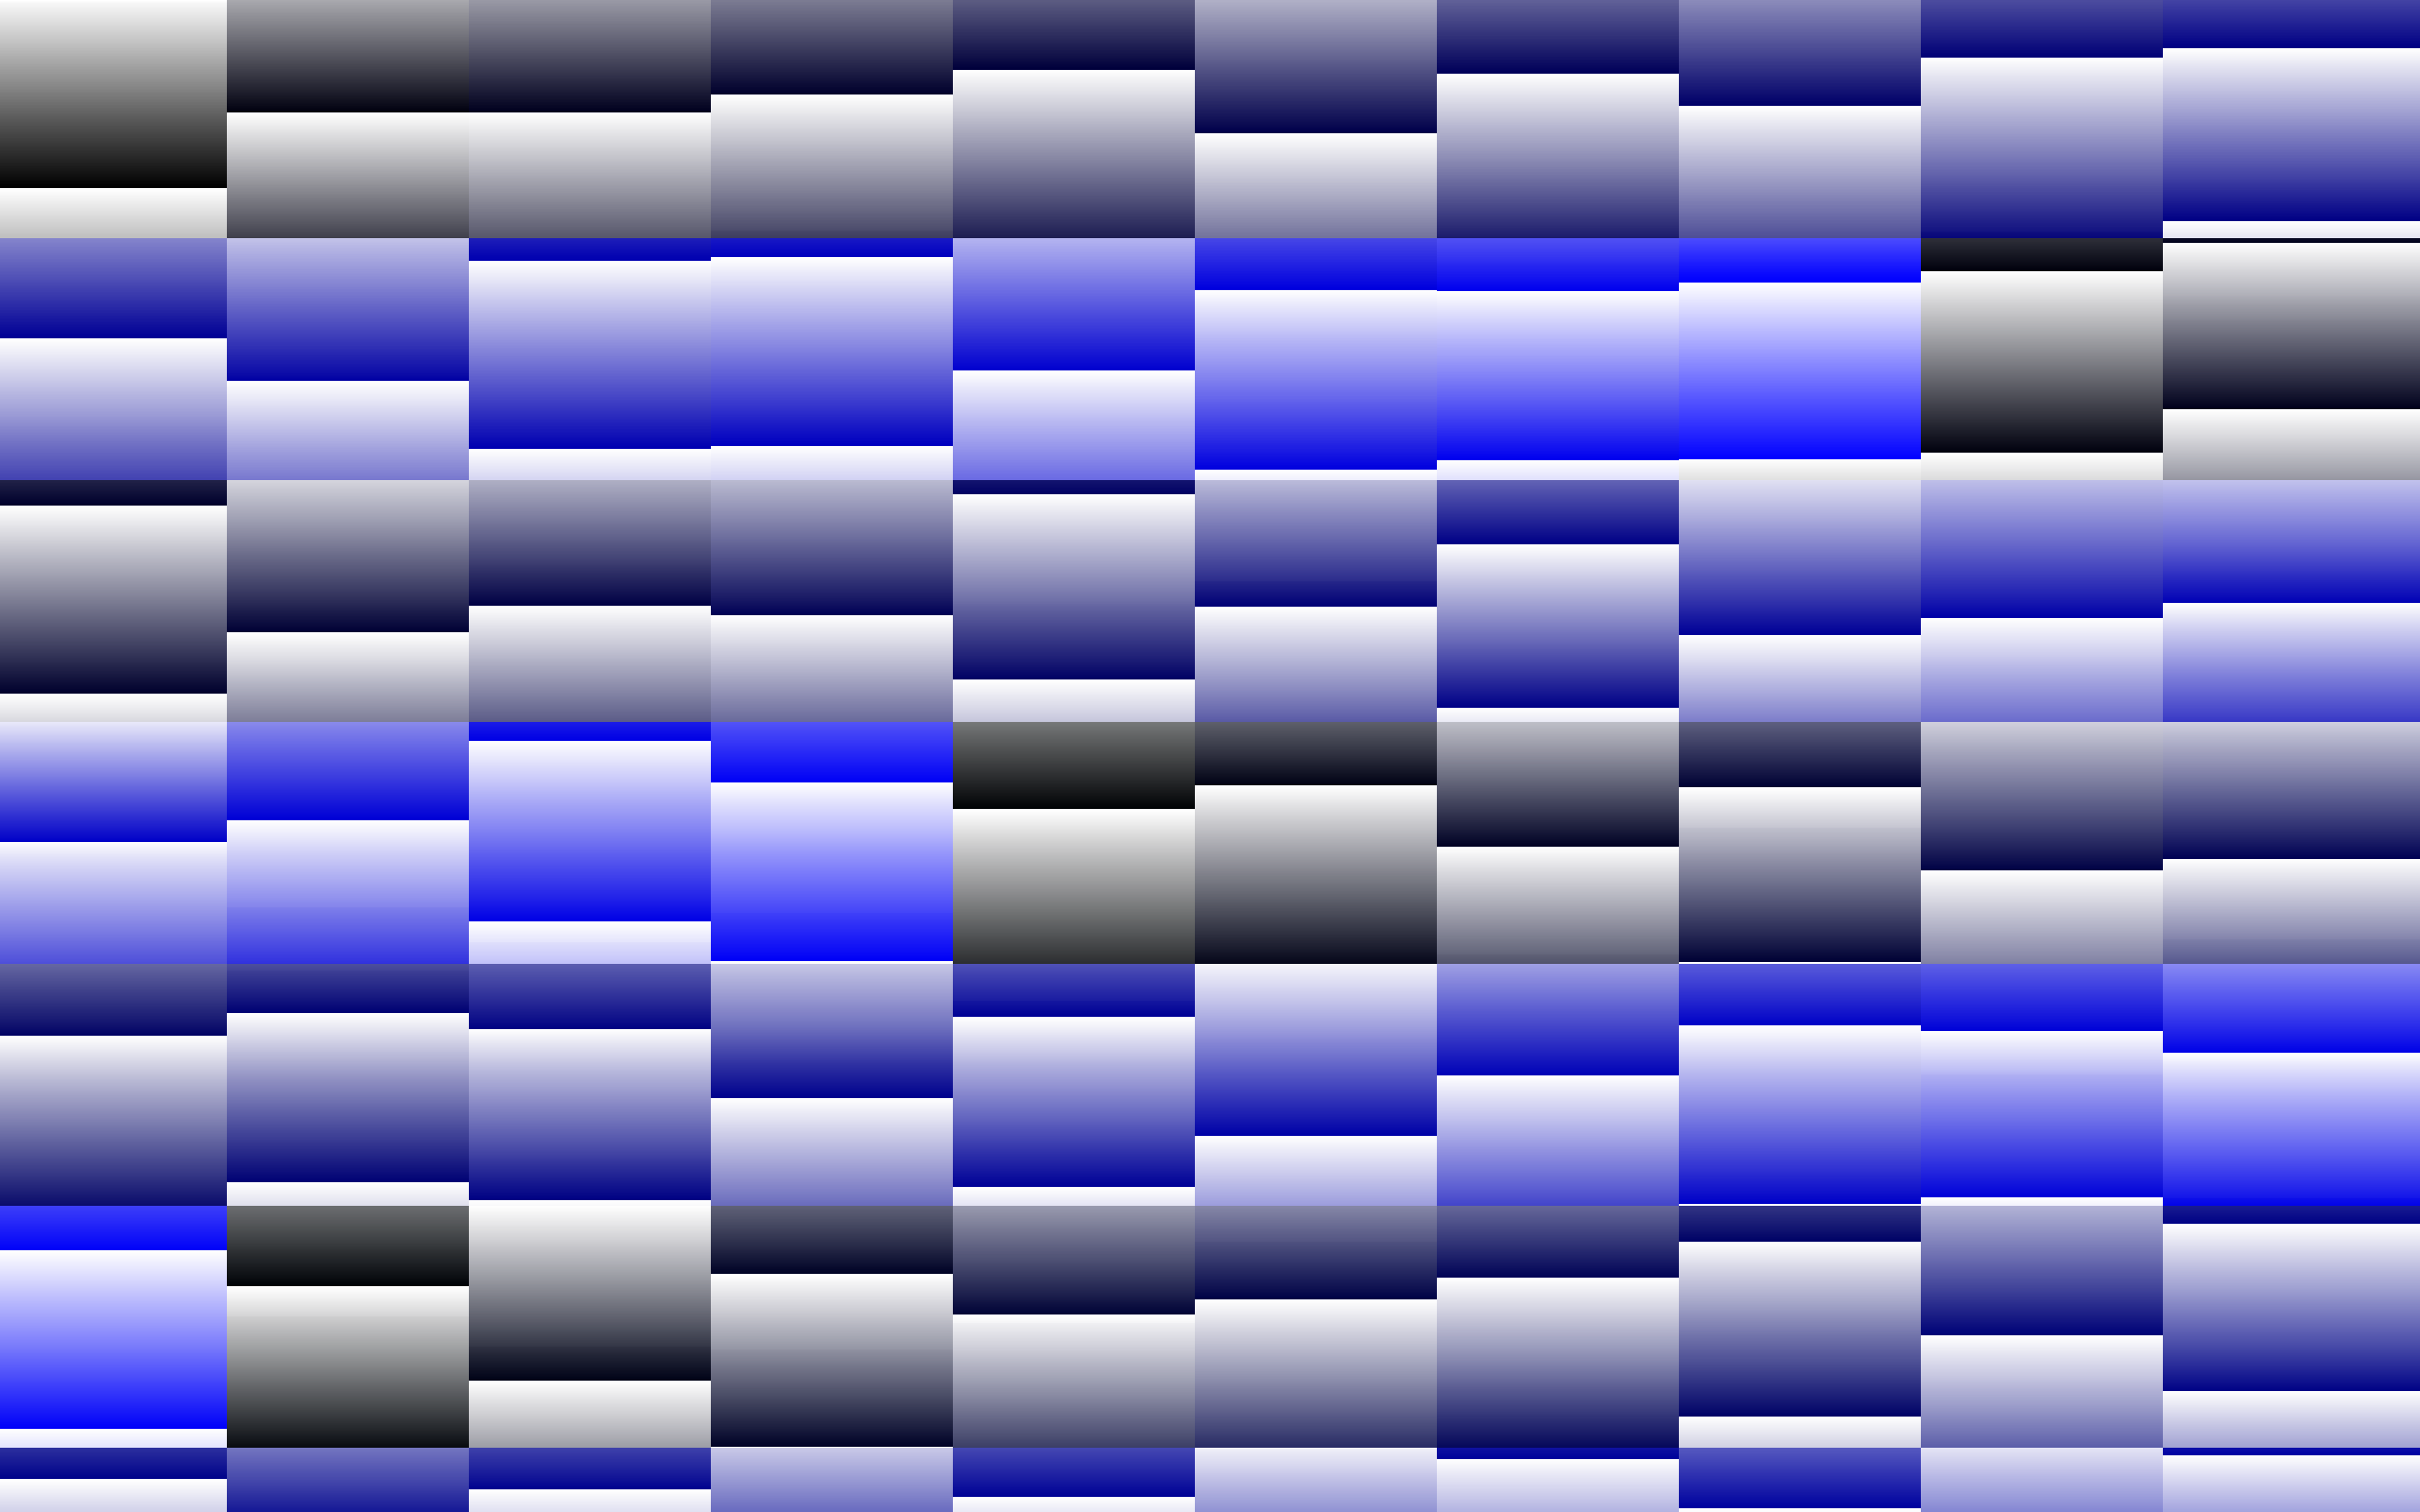
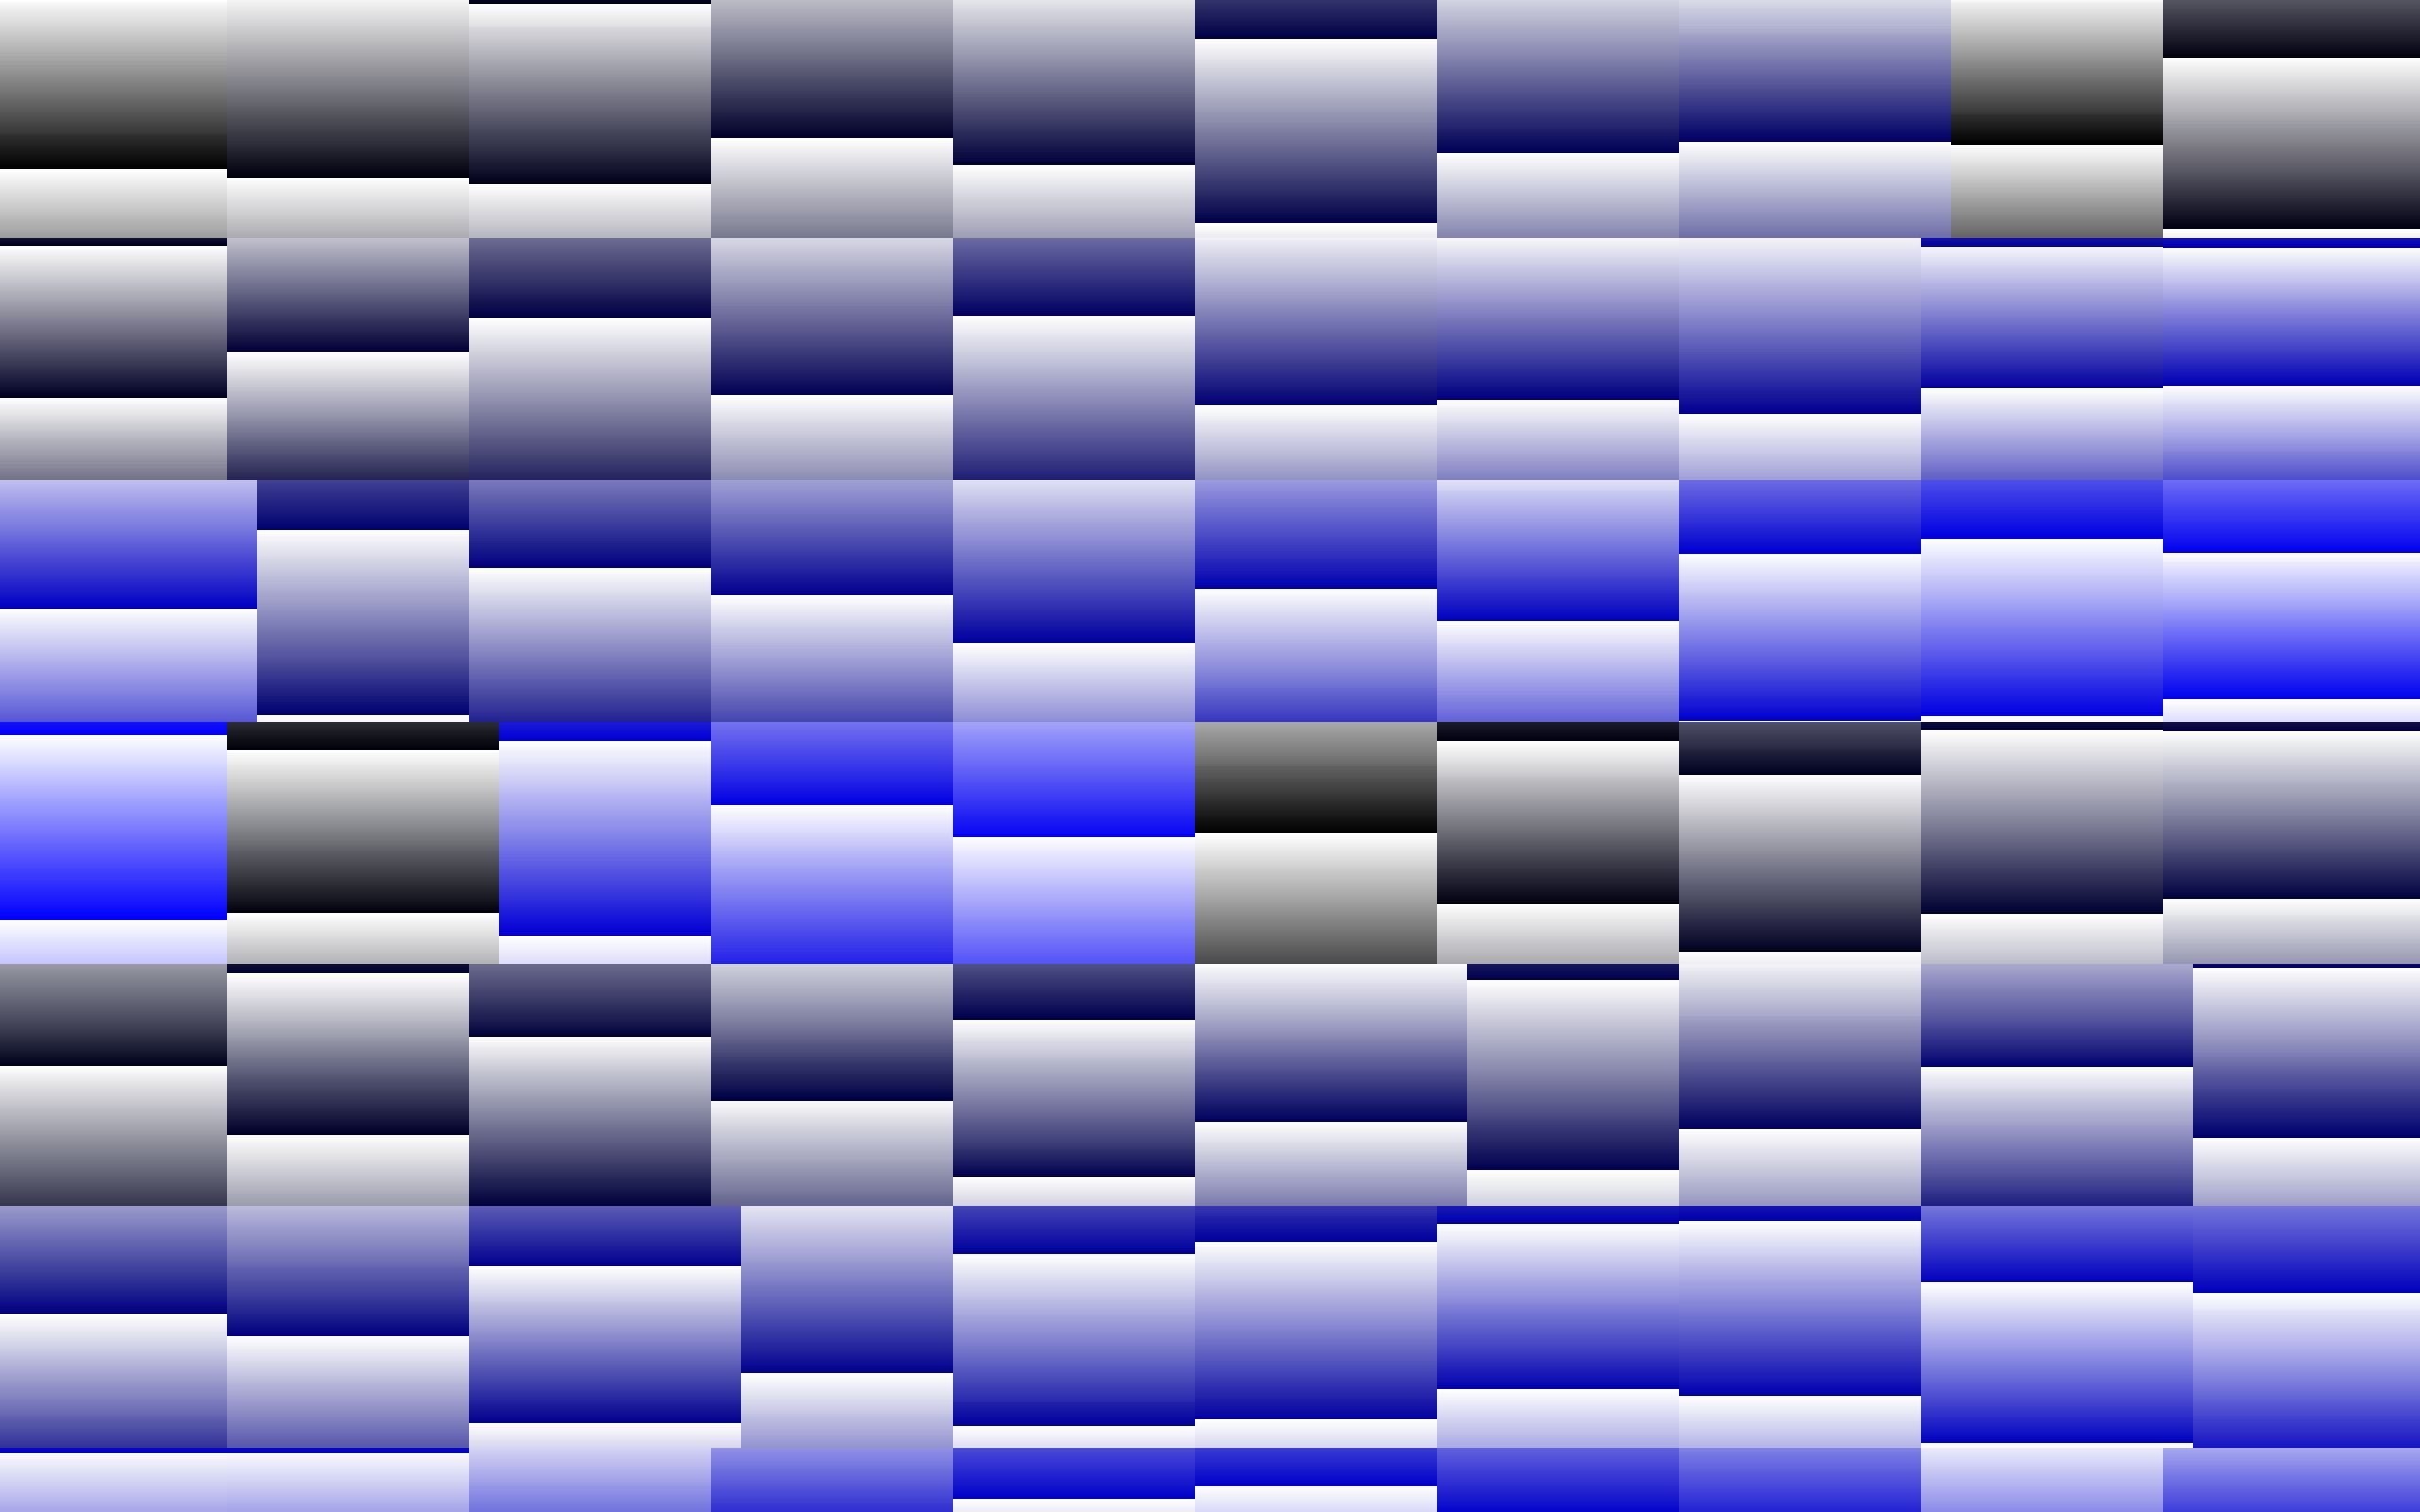
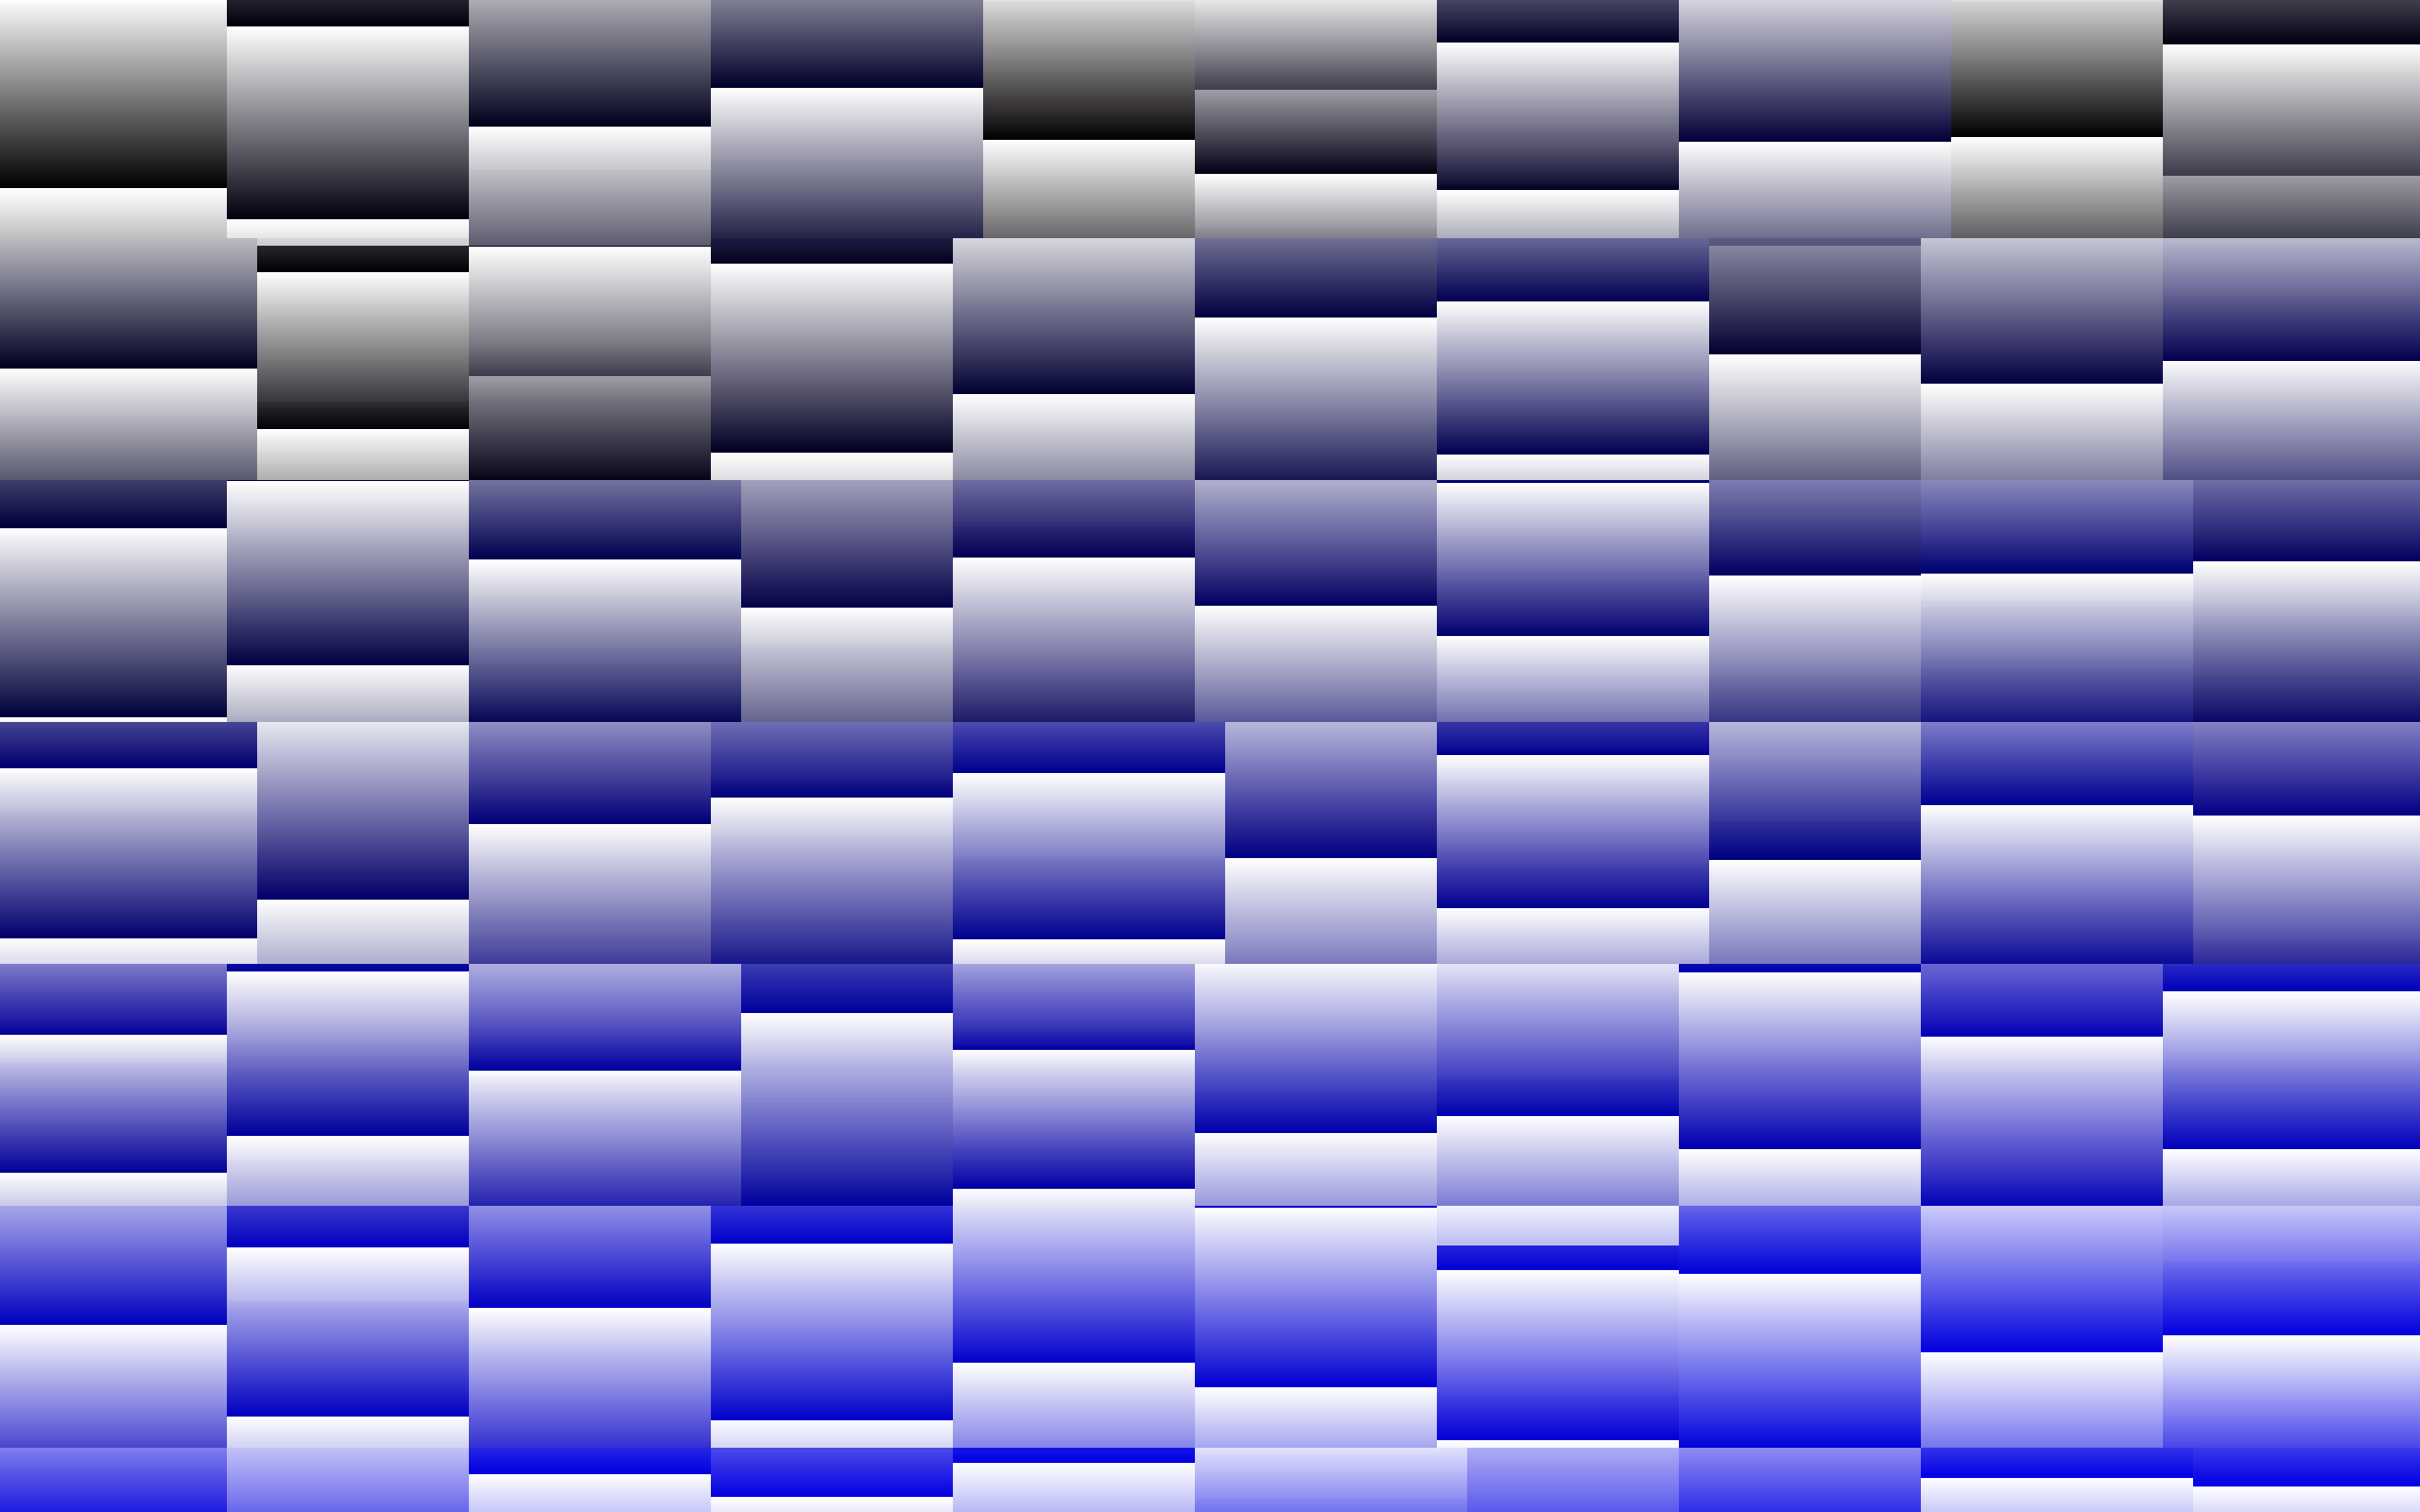
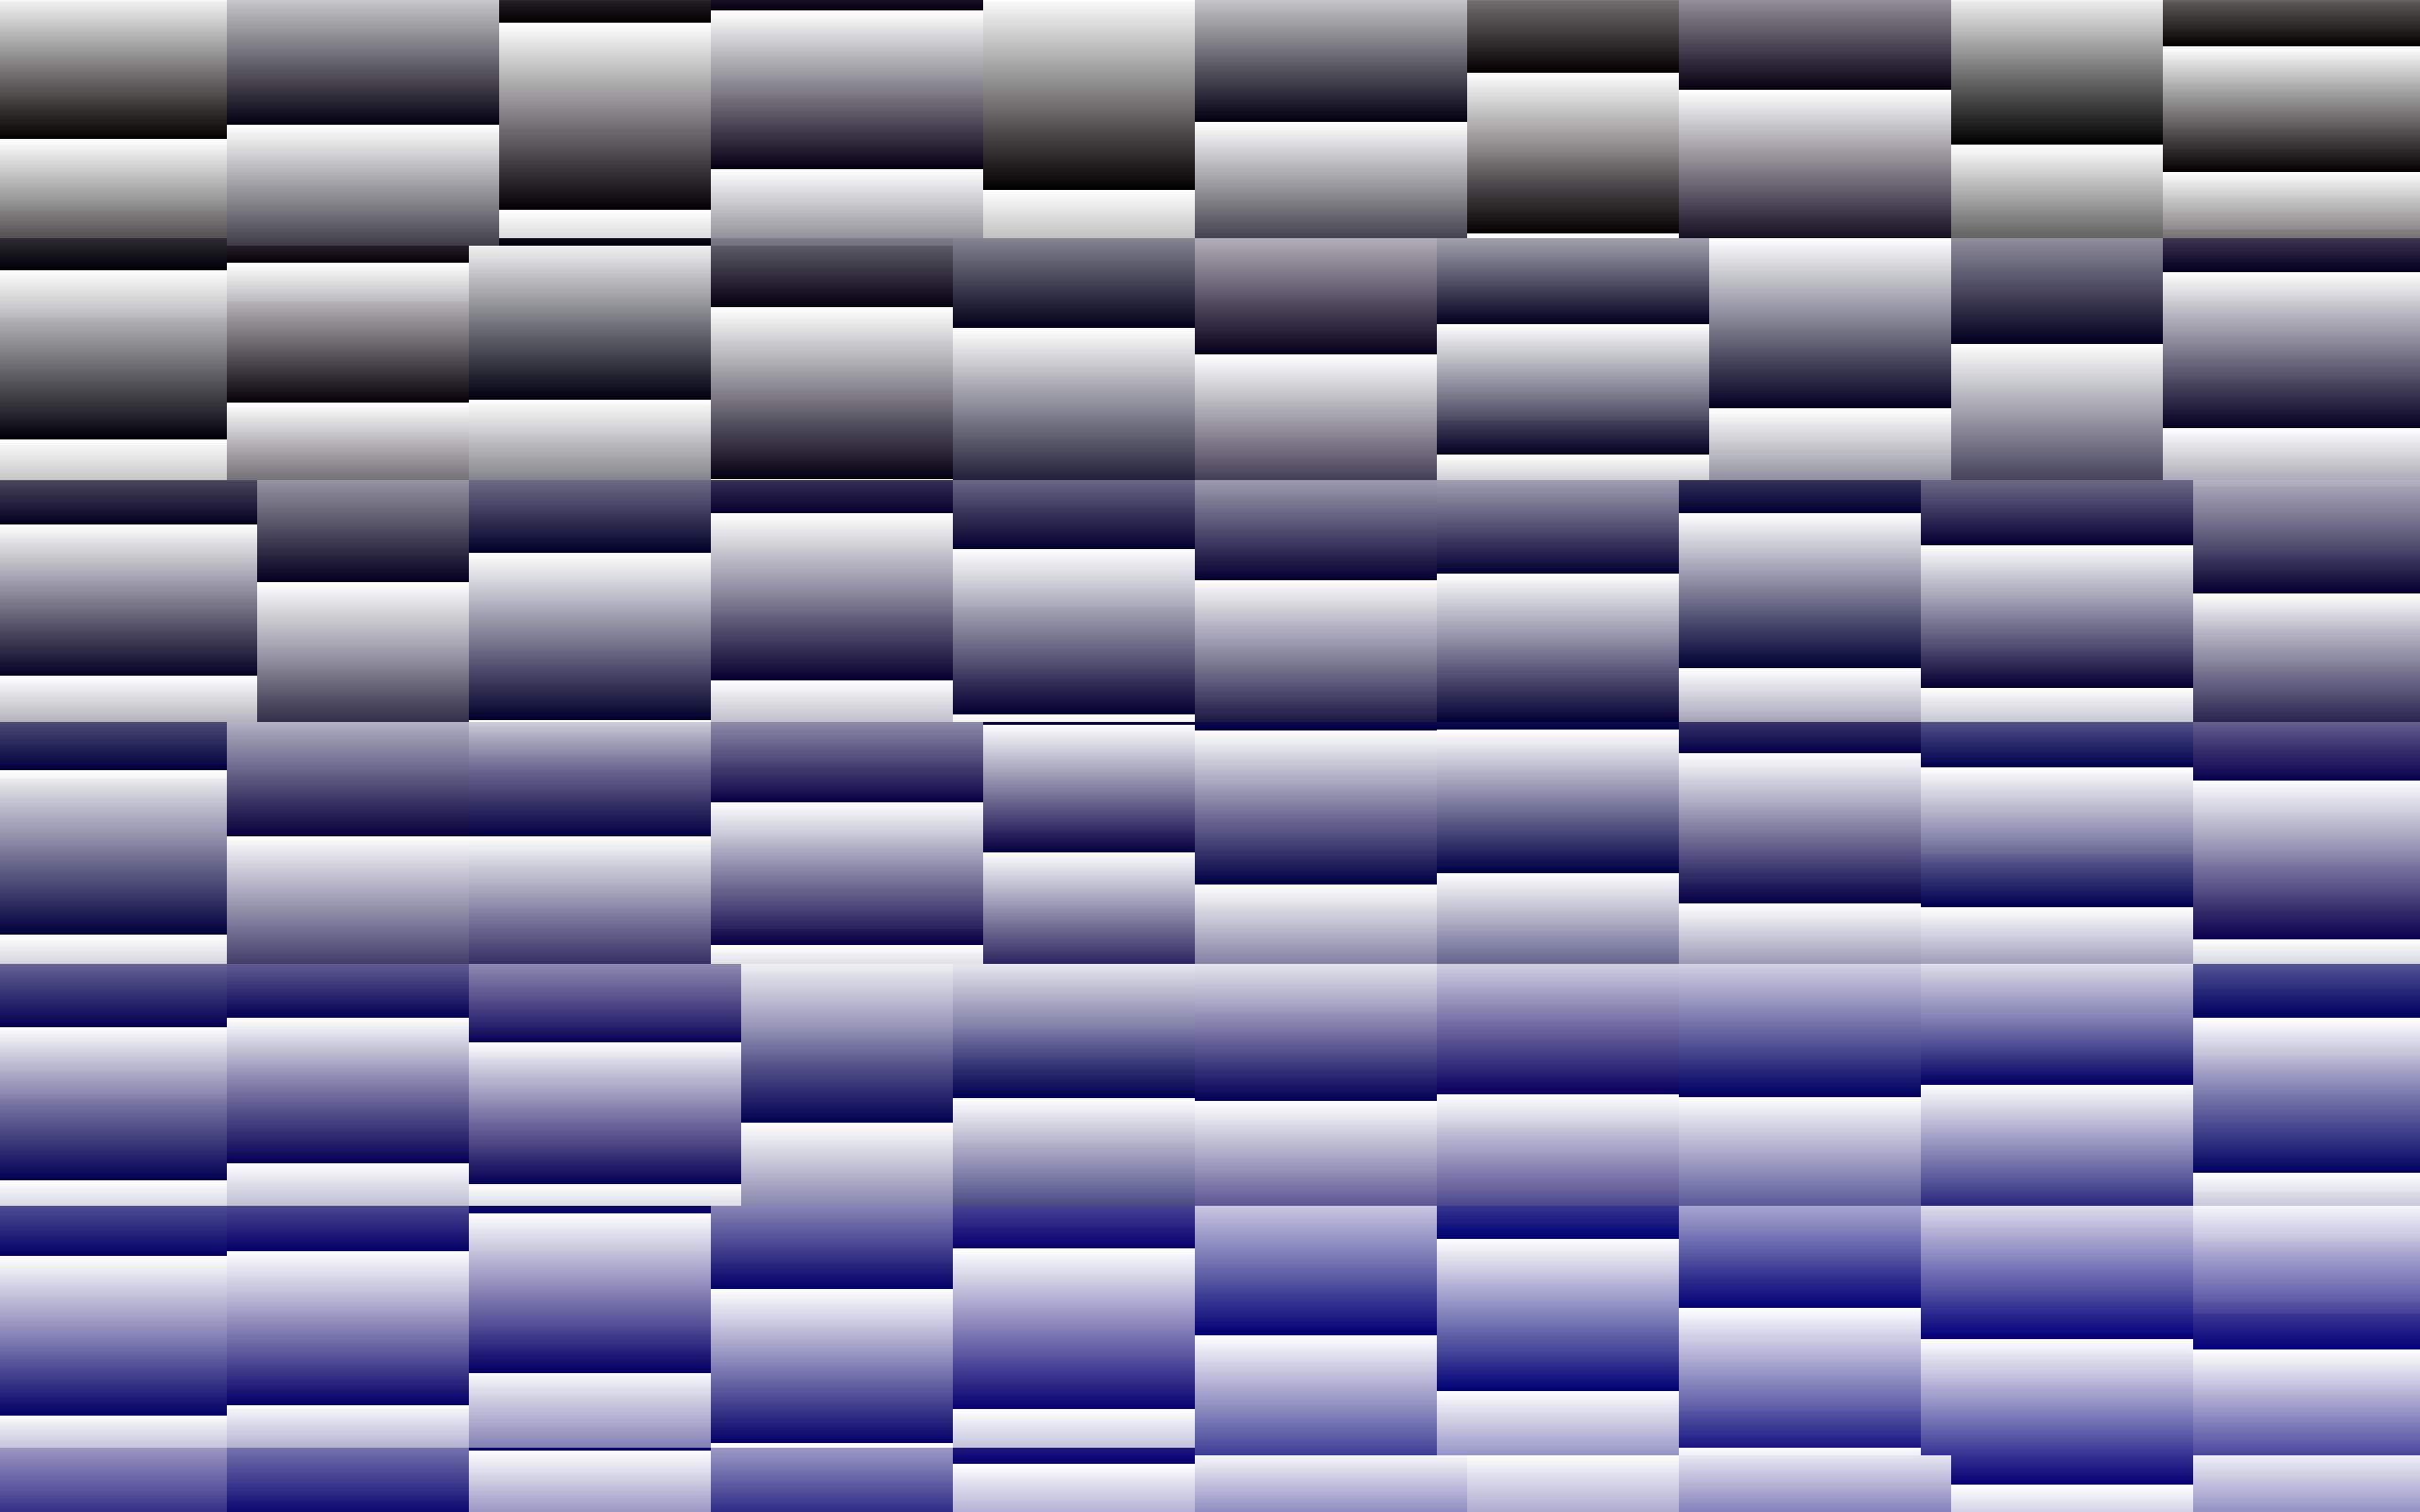
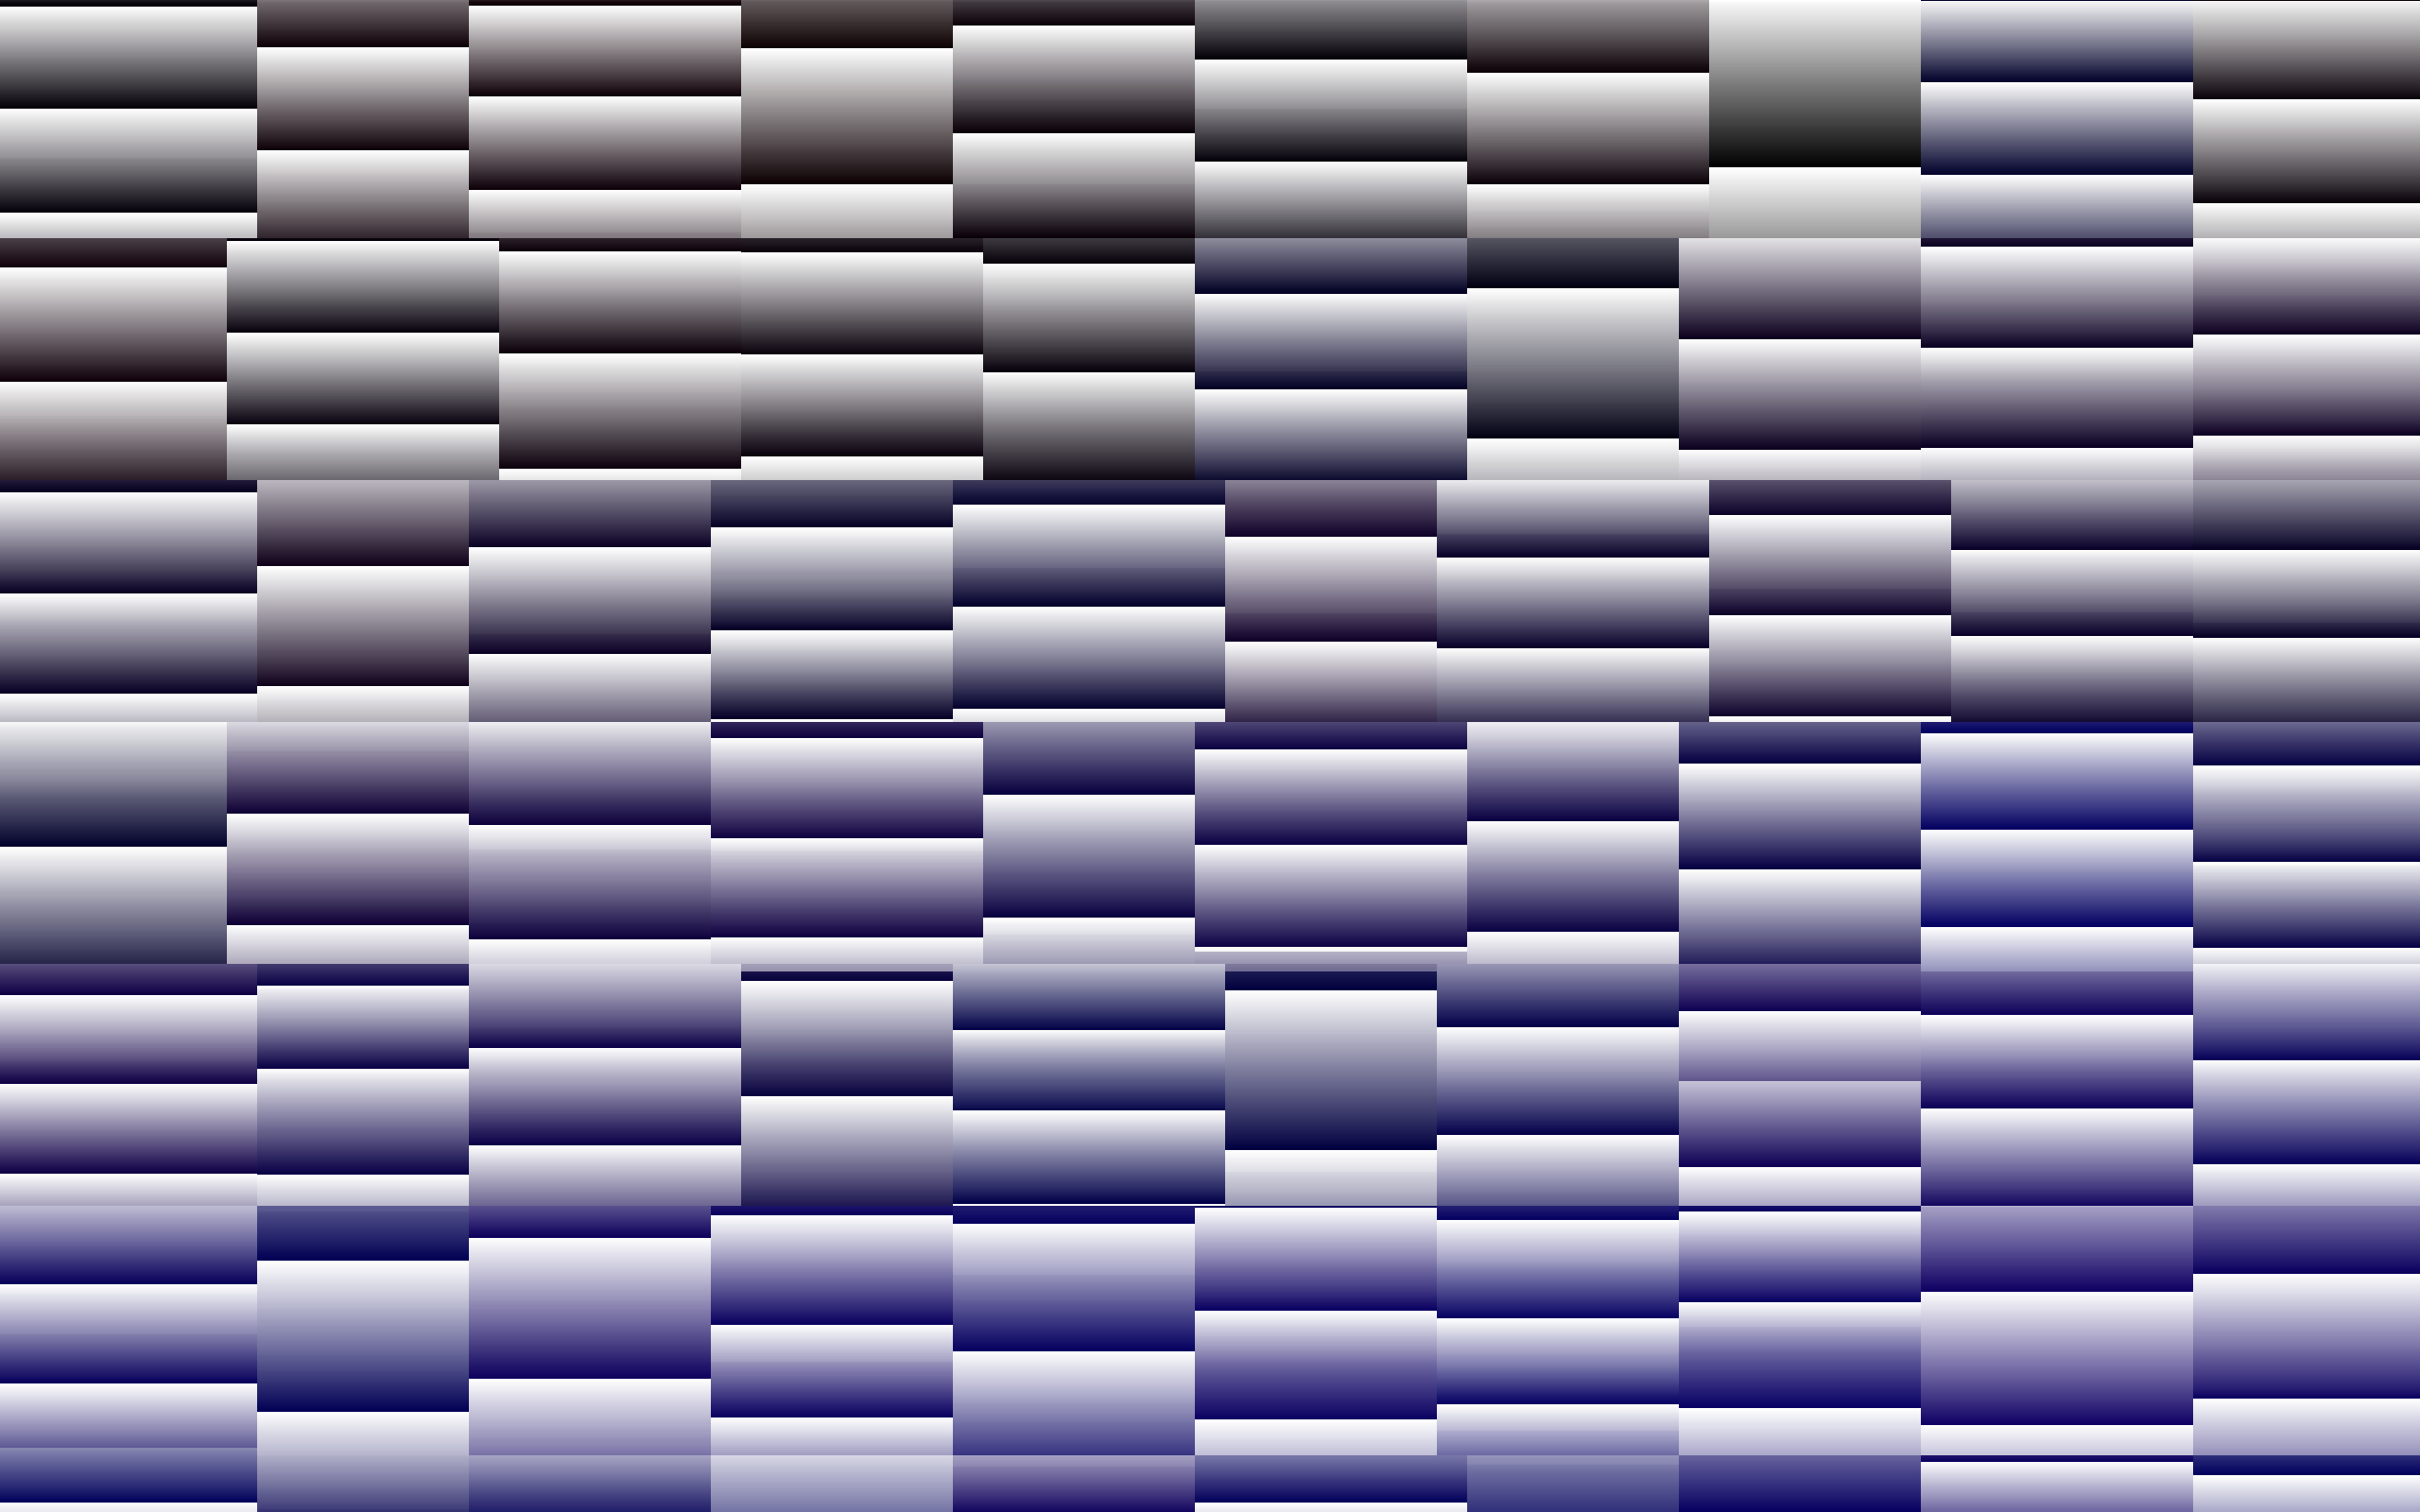
The videos above were rendered by stepping through the trace .jxl files frame by frame, but you can also just look at one directly: the spatial layout of threads and timings is visible at a glance.
The thumbnails below are PNG re-encodes of the original JPEG XL traces, because JPEG XL browser support is still patchy. Click a thumbnail for the full-size PNG, or grab the .jxl from the link underneath.
Pineapple-alpha previews are shown at native resolution (2,560 × 1,600). Cargo previews are downsampled to fit within a 2,560-pixel bounding box, since 230 Mpx of trace data is too much to ship to a browser inline. All the .jxl links go to full-resolution originals hosted on a separate Netlify drop, so you can grab the bit-exact traces for either image.
cargo
pineapple-alpha
Reproducing it
The C program that captures the trace (using libjxl) and the trace-rendering tool live at ender672/libjxl-thread-visualization.